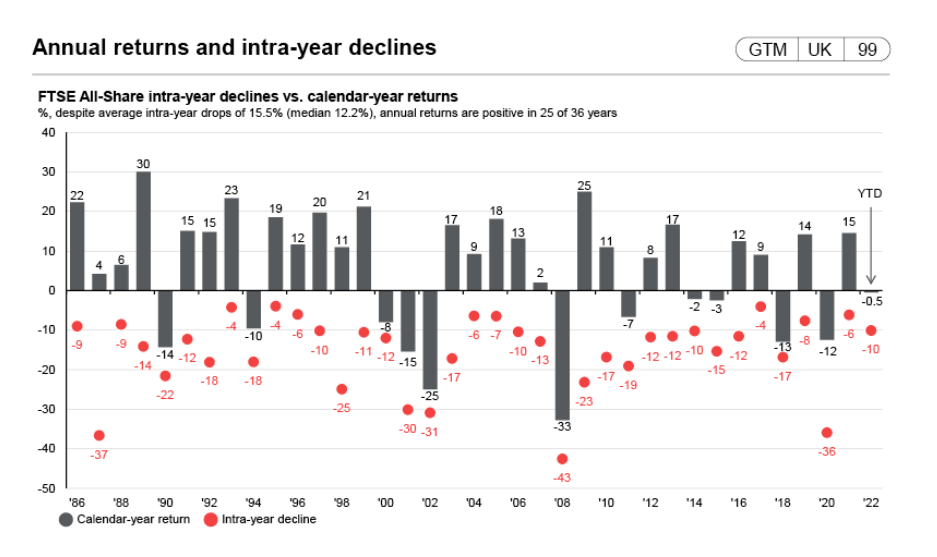
Similar to the S&P 500 Index, the FTSE All-Share Index for the UK equity market has also generated positive year-end returns in most of the recent few years though the intra-year declines was negative. The following chart shows the intra-year highest declines vs. year-end calendar returns for the FTSE All-Share Index from 1986 to 2022 year-to-date:
Click to enlarge
Source: The Bear Market issue, Permanent Wealth Partners
Note: The FTSE All-Share Index is comprised of the FTSE 100, FTSE 250 and the FTSE Small-Cap Index in the UK market
From the above-linked piece:
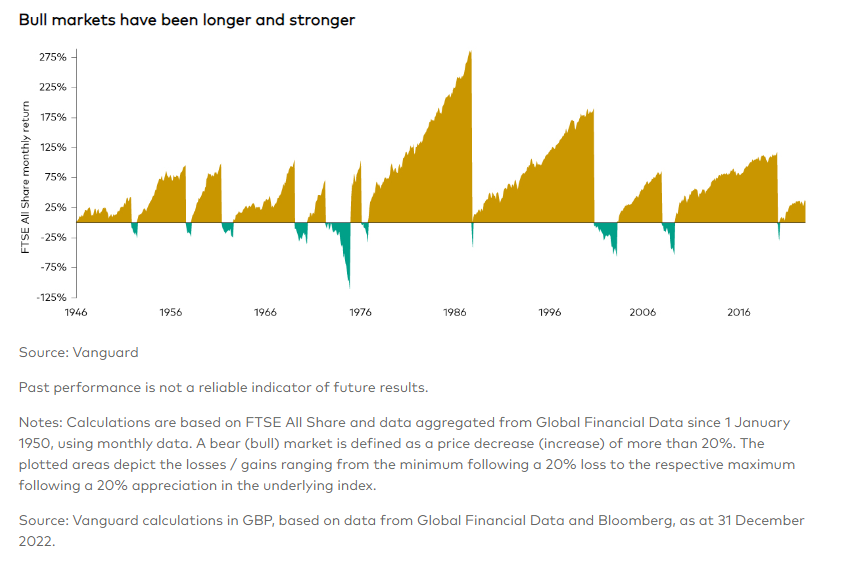
This grey bar shows the end-of-year returns for the FTSE All-Share, but the red dot and number show the scale of the largest intra-year decline from peak to trough. There are 8 years out of 36 where the intra-year decline has been greater than 20%, so just under 1 in 4. And many more at 17%, 18% or 19%.
The key takeaway is that volatility in the markets is a feature and not a bug. Markets never constantly go in one direction. When stocks decline as in the current bear market it is important to keep calm and not react by making rash decisions.
Related ETFs:
- iShares MSCI United Kingdom Index (EWU)
Disclosure: No positions