Crude oil is the most traded commodity in the world. However other than just supply and demand, a multitude of factors impact oil prices on a daily basis. Similar to the crude oil example, the prices of food are affected by a variety of complex factors. While in the past, food prices were determined just by the variables of supply and demand, today many factors come into play. The following graphic shows some of the factors and their impact on global food prices:
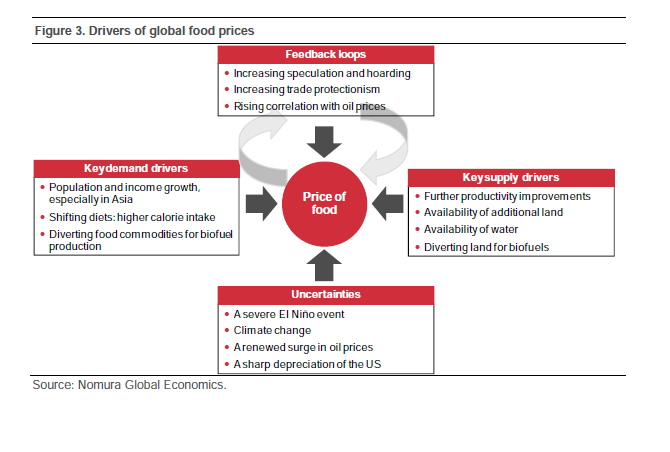
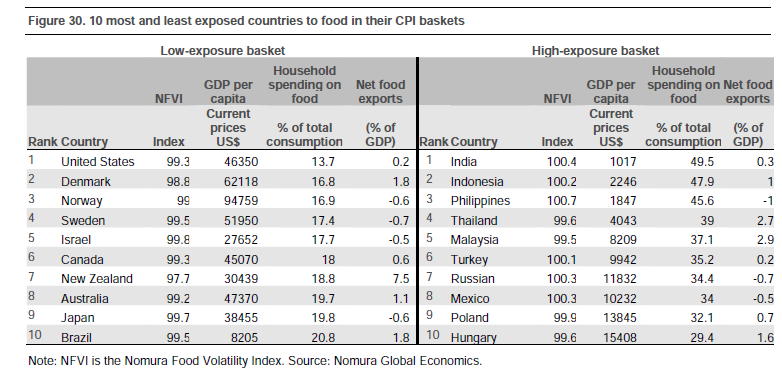
Source: Nomura Global Economics
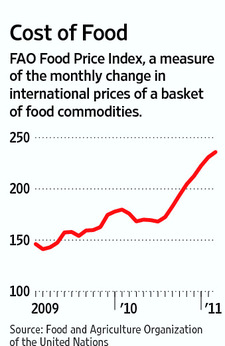
One of the main factors that affect food prices is the price of oil. As the price of oil has shot up in recent months food prices have also followed suit. The following chart from a Journal article confirms this trend:
From the article:
The Food and Agriculture Organization price index rose by 2.2%—the eighth consecutive rise since June—to an average of 236 points last month, the highest record in real and nominal terms since the agency started monitoring prices in 1990.
Global cereal supplies are also expected to tighten sharply this year due low stock levels, the FAO said. The body raised its estimate for world cereal production in 2010 by eight million metric tons from its December estimate to 2.2 billion tons but said it expects that to be outpaced by an 18 million-ton increase in world consumption.
But while the world isn’t yet facing a food crisis, the secretary of the FAO’s Intergovernmental Group on Grains, Abdolreza Abbassian, said the recent rise in Brent oil prices to above $120 a barrel could create the same potent mix of factors that pushed grain prices to record highs three years ago.
Another factor affecting global food prices is the rise in speculation in food commodities. From a CFR 2009 article on food prices:
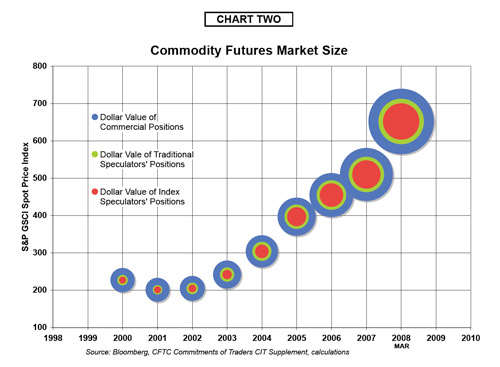
Source: CFR
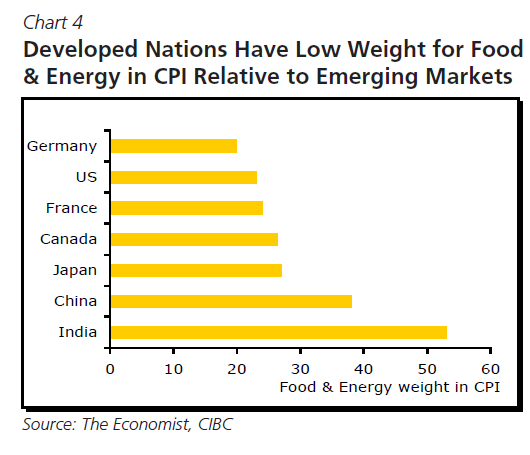
Rising food prices may also affect the fragile economic recovery. As struggling consumers battle on two fronts – one with soaring fuel prices and the other with food costs – they may cut down on spending on other goods and services. A recent article in This is Money website of UK noted this point:
“Economists also fear that food price hikes will reduce economic activity and squeeze household spending as families desperately cut back elsewhere.
A UN report yesterday revealed that rises in bread, pasta, breakfast cereal, dairy and meat prices are on the horizon – irrespective of future oil price hikes.
The commodity price of key foods rose again in February, making it the eighth successive month of increases, according to the UN Food & Agriculture Organisation. It pointed out the export prices of wheat, corn and rice are up by a staggering 70% in one year.”
Overall if oil prices do not fall there is a serious risk for the global economy to enter into a recession again.

 Back to Old-Fashioned Saving, Benjamin Tal, CIBC World Markets