The Case for High-Yielding Foreign Dividend Stocks

In a December 2009 post I wrote that the S&P 500 Index lost 23% from Dec 31, 1999 thru Dec 14, 2009 referring to an article in Bloomberg BusinessWeek. During this time the indices of many other countries performed relatively better than the S&P 500. In that same article I quoted a piece in The Wall Street Journal which said:

The U.S. stock market is wrapping up what is likely to be its worst decade ever.

In nearly 200 years of recorded stock-market history, no calendar decade has seen such a dismal performance as the 2000s.

Investors would have been better off investing in pretty much anything else, from bonds to gold or even just stuffing money under a mattress. Since the end of 1999, stocks traded on the New York Stock Exchange have lost an average of 0.5% a year thanks to the twin bear markets this decade.

The period has provided a lesson for ordinary Americans who used stocks as their primary way of saving for retirement.

Many investors were lured to the stock market by the bull market that began in the early 1980s and gained force through the 1990s. But coming out of the 1990s—when a 17.6% average annual gain made it the second-best decade in history behind the 1950s—stocks simply had gotten too expensive. Companies also pared dividends, cutting into investor returns. And in a time of financial panic like 2008, stocks were a terrible place to invest.

With two weeks to go in 2009, the declines since the end of 1999 make the last 10 years the worst calendar decade for stocks going back to the 1820s, when reliable stock market records begin, according to data compiled by Yale University finance professor William Goetzmann.

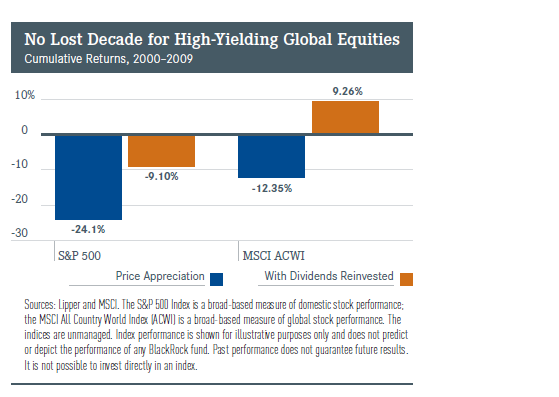
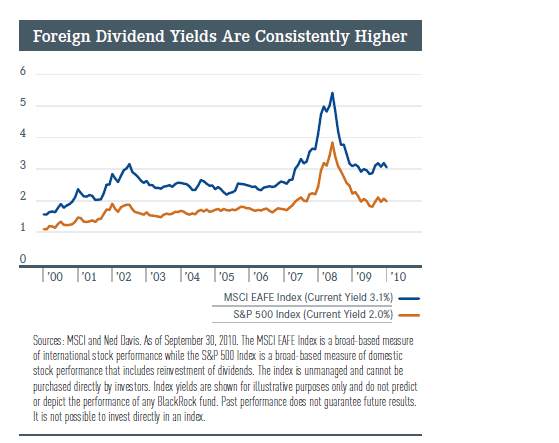
While U.S. stocks performed poorly in the last decade, foreign dividend-paying stocks performed especially well. More specifically global high-dividend paying and high-dividend growth stocks consistently outperformed the broad market.


foreign-us-dividend-compare.png

foreing-stocks-no-lost-decade.png

So should investors hold dividend-paying foreign stocks ?

The answer is an absolute “yes”. Here are three reasons to hold these stocks:

  • Since 1970 more than 80% of European returns have come from a combination of yield and real dividend growth.
  • According to a research report by Société Générale, over the past 30 years, well over 90% of UK, Germany and France returns have come from dividends and dividend growth.
  • Even in high-growth regions such as Asia excluding Japan, that figure stands at about 60% over the past 30 years.

Source: Why Dividend Make A Difference, Black Rock, Dec 2010

18 high-dividend paying foreign stocks from the STOXX Global 1800 Index are listed below with their current dividend yields:

1.Company: Astrazeneca (AZN)
Current Dividend Yield: 7.14%
Sector: Drugs
Country: UK

2.Company:Australia & New Zealand Banking (ANZBY)
Current Dividend Yield: 5.93%
Sector: Banking
Country: Australia

3.Company: Bank of Montreal (BMO)
Current Dividend Yield: 4.70%
Sector: Banking
Country: Canada

4.Company: Banco Santander (SAN)
Current Dividend Yield: 12.02%
Sector: Banking
Country: Spain

5.Company: Belgacom (BGAOY)
Current Dividend Yield: 13.64%
Sector: Telecom
Country: Belgium

6.Company:Canadian Imperial Bank of Commerce (CM)
Current Dividend Yield: 4.19%
Sector: Banking
Country: Canada

7.Company:CRH plc (CRH)
Current Dividend Yield: 5.47%
Sector:  Construction & Materials
Country: Ireland

8.Company:DBS Group Holdings Ltd. (DBSDY)
Current Dividend Yield: 3.82%
Sector: Banking
Country: Singapore

9.Company: Deutsche Telekom (DTEGY)
Current Dividend Yield: 7.00%
Sector: Telecom
Country: Germany

10.Company: E.ON (EONGY)
Current Dividend Yield: 7.44%
Sector:Utilities
Country: Germany

11.Company: Enel (E)
Current Dividend Yield: 7.48%
Sector:Utilities
Country: Italy

12.Company: France Telecom (FTE)
Current Dividend Yield:
Sector: Telecom
Country: France

13.Company: GlaxoSmithKline (GSK)
Current Dividend Yield:
Sector: Drugs
Country: UK

14.Company:Keppel Corp. Ltd. (KPELY)
Current Dividend Yield: 4.13%
Sector: Oil & Gas
Country: Singapore

15.Company:National Australia Bank Ltd. (NABZY)
Current Dividend Yield: 5.42%
Sector: Banking
Country: Autralia

16.Company:United Overseas Bank Ltd. (UOVEY)
Current Dividend Yield: 4.03%
Sector: Banking
Country: Singapore

17.Company:Statoil (STO)
Current Dividend Yield: 4.29%
Sector: Oil & Gas
Country: Norway

18.Company: United Utilities Group (UUGRY)
Current Dividend Yield: 3.20%
Sector:Utilities
Country: UK

Note: Dividend yields noted are as of May 13, 2011

Disclosure: Long STD,CM,BMO,EONGY
Will the U.S. Default?

The European debt crisis is again taking the center stage in recent weeks as countries such as Greece and Portugal are struggling with mountains of debt and may need further bailouts. As we all know there is good and bad debt. Just like individuals, the type of debt a country holds and the ability to repay them is very important when considering the possibility of defaults.

From an article titled “How Much Debt Is Too Much?” by Marcel Thieliant of Credit Suisse Private Banking:

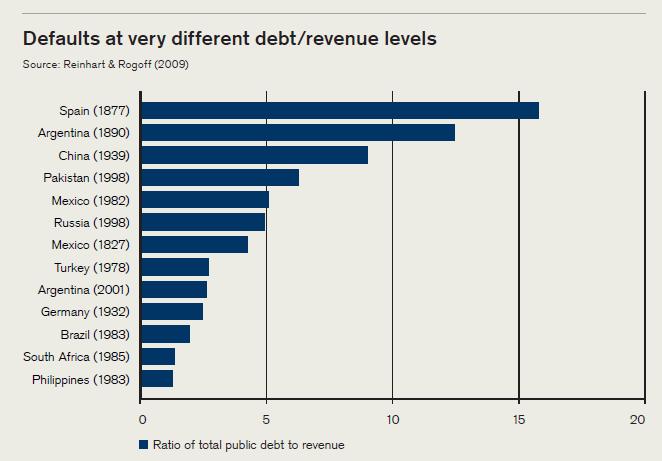
Is there a clear limit for government debt, beyond which things can go wrong? The short answer is “no”. This is illustrated, for example, by data from Reinhart & Rogodd, which shows that past defaults occurred at wide range of government debt-to-revenue ratios (see below). So what are the factors that determine which debt is sustainable? First of all, looking only at gross debt is misleading.If a government has a large amount of assets, it can in principle use these to repay debt. For example, while Japan has by far the highest government debt to GDP in the world, its ratio of net debt to GDP is much lower, though still slightly higher than that of Greece.

Second, looking at the public sector is not sufficient. If a country has large private savings, these can in principle be used to finance the public debt, especially if investors have a strong home bias. In Greece and Portugal and to a lesser extent in Spain, domestic savings are low, so public debt was financed by more “fickle” foreign investors; all three countries are net foreign debts. For large debtors, default risk is much lower if the debt is denominated in their own currency, especially if it is a global reserve currency.This suggests that US sovereign risk is limited, despite high public and national debt.Finally the ability to collect taxes also affects the ability to service sovereign debt.This, in turn, depends on the wealth and income of the country, the efficiency of the government and tax authorities, and the willingness of citizens to pay taxes rather than evade them.

country-defaults.jpg

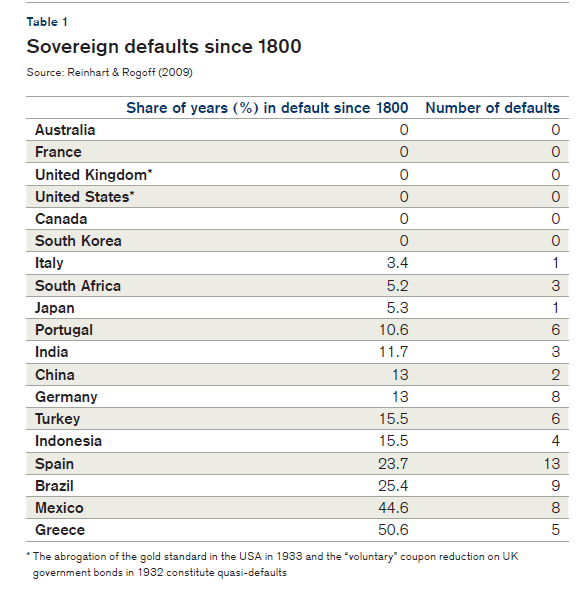
Sovereign debt defaults since 1800 are shown in the chart below:

Sovereign-Defaults-since-1800

Source: Country Indebtedness, An Update, Credit Suisse

The current U.S. debt ceiling remains at $14.20 Trillion. U.S. Treasury Timothy Geithner has urged Congress to lift the ceiling since the limit will be reached on Monday, May 16th. From a news report:

WASHINGTON — Three days before the US public debt hits its legal limit, US Treasury Secretary Timothy Geithner urged lawmakers to lift the ceiling to ensure confidence remains in the world’s largest economy.

“On Monday, May 16 — just three days from today — the United States will reach the debt limit set by Congress,” Geithner said.

“I want to again encourage Congress to move as quickly as possible, so that all Americans will remain confident that the United States will meet all of its obligations — not just our interest payments but also our commitments to our seniors,” he said.

Republicans in Congress have refused to raise the national debt ceiling, which now stands at $14.29 trillion, unless they can get the White House and its Democratic supporters to agree to sweeping long-term spending cuts.

The administration of President Barack Obama has said they could agree cuts but they are also demanding some tax hikes to increase revenues.

The limit will be hit next Monday, after this week’s Treasury Department debt auctions are settled.

The current U.S. total debt and holders of that debt are shown below:

us-debt-2.png

Source: U.S. Department of the Treasury

As shown above, more than half of the total public debt is held by the U.S. public. This entire debt is highly unlikely to demanded to be repaid in full at once by Americans anytime soon.

The fact that Americans are the major holders of U.S. debt and not China as widely believed was discussed by fellow blogger and fund manager Barry Ritholtz in an article back in January. From the article titled “Is China Really Funding the US Debt?”:

I keep hearing people erroneously claim that China is funding US deficit spending. It seems that every eejit with a fundamental misunderstanding of mathematics (and access to Xtranormal‘s animated talking bears) has been pushing this concept.

It turns out to be only partially true — and by partially, I mean 7.5% true. But that means the statement is 92.5% false.

The biggest holders of US debt are American individuals, institutions, and Social Security. We own more than 2 out of every 3 dollars of US debt — about over 67%. Hence, we depend far less on the kindness of strangers than you might imagine if your listen to the intertubes.

Those viral animated bears may be clever, but they sure suck at math.

Total United States’ public debt was ~$13.562 trillion at the end of the fiscal year (30 September 2010). As of last week, January 4, 2011, the United States’ total public debt outstanding has surpassed 14 trillion dollars.

Foreign investors held $4.4 Trillion of U.S. Treasury securities at the end of Feb 2011.Out of this, China held the largest stake at about $1.4 Trillion. Unlike public debt shown above, foreigners holding U.S. debt may demand that the U.S. repay their debts in full anytime. However this scenario also is highly unlikely to occur due to many factors such as the U.S. dollar being the hard currency, the ability of the U.S. to comfortably repay the creditors by raising taxes, ability to repay using national wealth, etc as mentioned by Marcel Thieliant in his article. Hence last month’s news that S&P downgraded its outlook on the U.S. credit rating to “negative” and threatened to cut the AAA credit rating does not matter. In summary, the U.S. is unlikely to default on it debt.

15 Blue Chips from the Enlarged EU States

The STOXX EU Enlarged 15 Index represents the largest companies in the 10 European member states which joined the European Union after 2004: Cyprus, Czech Republic, Estonia, Hungary, Latvia, Lithuania, Malta, Poland, Slovakia, Slovenia, Bulgaria and Romania.

1.Company: Bank of Cyprus (BACPY)
Current Dividend Yield: 5.27%
Sector: Banking
Country: Cyprus

2.Company: CEZ (CZAVF)
Sector: Utilities
Country: Czech Republic

3.Company:KGHM
Sector: Basic Resources
Country: Poland

4.Company: Komercni Banka (KMBNY)
Current Dividend Yield:  3.01%
Sector: Banking
Country: Czech Republic

5.Company: KRKA
Sector: Healthcare
Country: Slovakia

6.Company: Magyar Telecom (MYTAY)
Current Dividend Yield:  11.84%
Sector: Telecom
Country: Hungary

7.Company: MOL Magyar Olaj-Es Gaipari (MGYOY)
Sector: Oil & Gas
Country: Hungary

8.Company: OTP Bank
Sector: Banking
Country: Hungary

9.Company: Pekao
Sector: Banking
Country: Poland

10.Company: PGE
Sector: Utilities
Country: Poland

11.Company: PKO Bank
Sector: Banking
Country:  Poland

12.Company: Polish Oil and Gas
Sector: Oil & Gas
Country: Poland

13.Company: Richter Gedeon
Sector: Healthcare
Country: Hungary

14.Company: Telefonica O2 Cz
Sector: Telecom
Country: Czech Republic

15.Company: Telekomunikacja Polska
Sector: Telecom
Country: Poland

Related ETFs:

iShares Emerging Markets Eastern Europe (ESR)
Market Vectors Poland (EPOL)
SPDR S&P Emerging Europe (GUR)

Disclosure: No positions

Review: The Financial System in Mongolia

The financial system in Mongolia is dominated by commercial banks. As of September 2010, the 14 registered commercial banks accounted for 96 percent of total financial system assets.The Mongolia Stock Exchange(MSE) was established in 1991, following the privatization of 475 state-owned enterprises. About 337 companies are now listed on the MSE. The size of the whole Mongolian equity market is tiny. As a country rich in many untapped mineral resources, some of the top mineral exports of Mongolia are gold, copper and coal.

stock_exchange_mongolia.jpg

Mongolia Stock Exchange, Ulan Bator, Mongolia

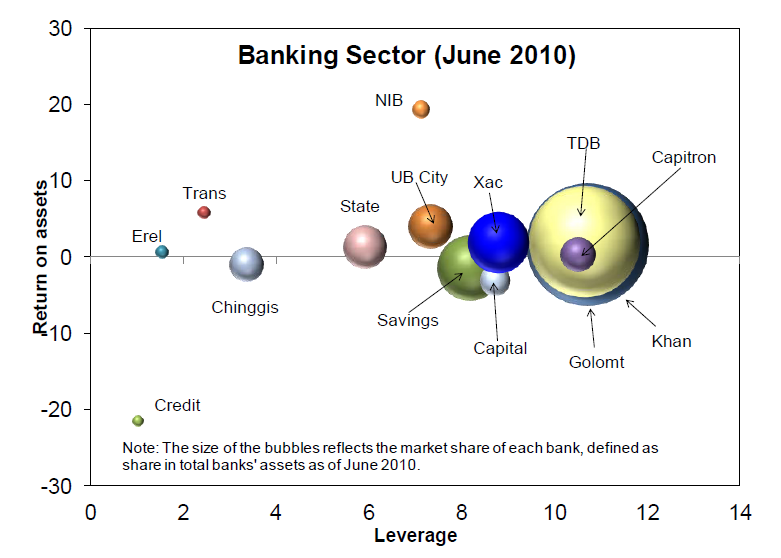
The graphic below shows the largest Mongolian banks based on assets:

top-mongolia-banks.png

Source: Mongolia: Financial System Stability Assessment, May 2011, IMF

Additional resources:

Companies listed on the Mongolia Stock Exchange

Mongolia Stock Exchange

Investing with Emotions

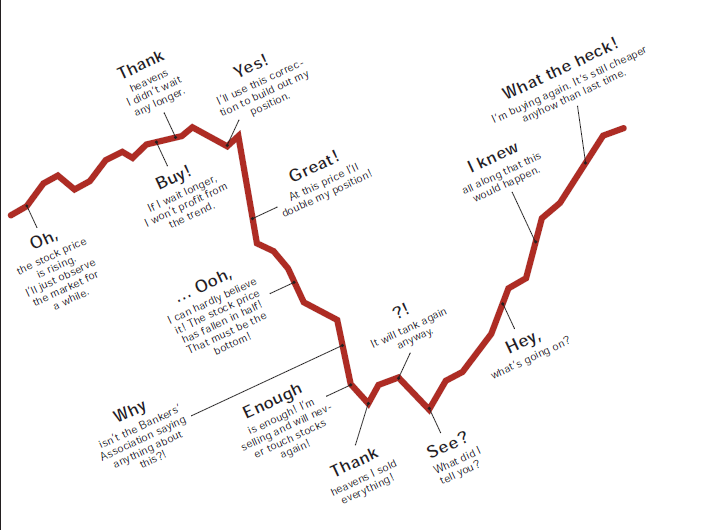
Investing in the markets is not suitable for everyone.One should have a strong stomach when markets dive and not get carried away with greed when markets soar.The following chart shows the various stages of emotions that most investors experience with investing in equities:

Click to enlarge

investing-with-emotions.png

Source: Emotions and markets, Global Investor, Credit Suisse

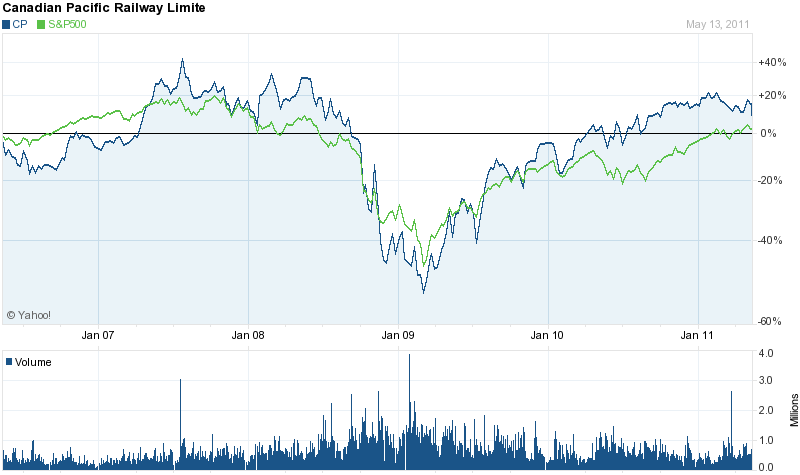
A classic example of the above scenario occurred in 2009. After declining heavily in 2008, stocks bottomed out in March 2009. Seeing their portfolios crushed, some investors sold out in March and then regretted that decision when markets around the world staged a powerful rally.

The following chart shows the 5-year performance of Canadian Pacific (CP), a railroad in Canada and the S&P 500:

sp-cp-5-year-chart.png

Disclosure: No Positions