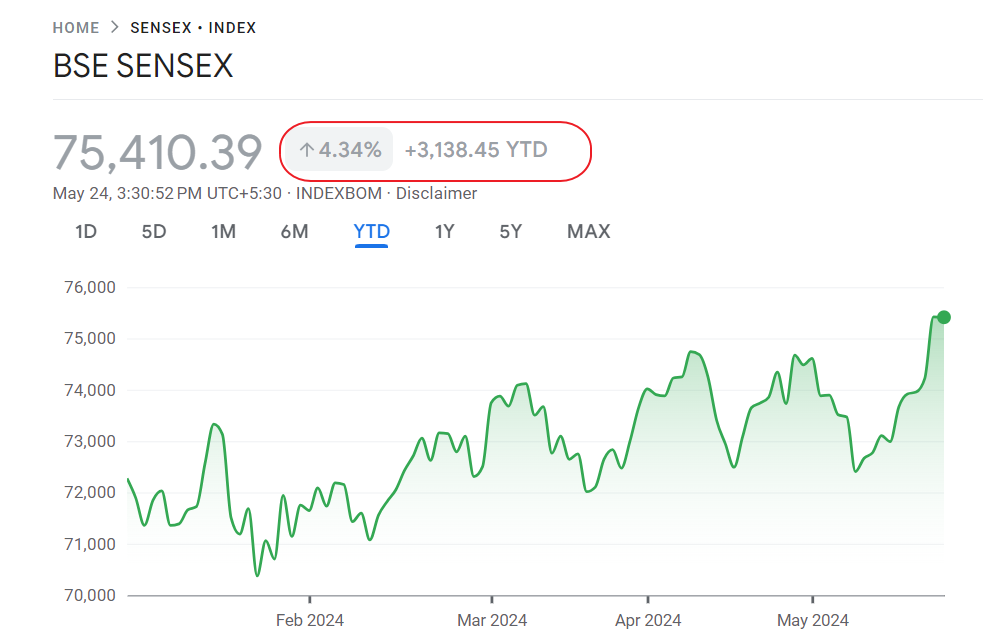
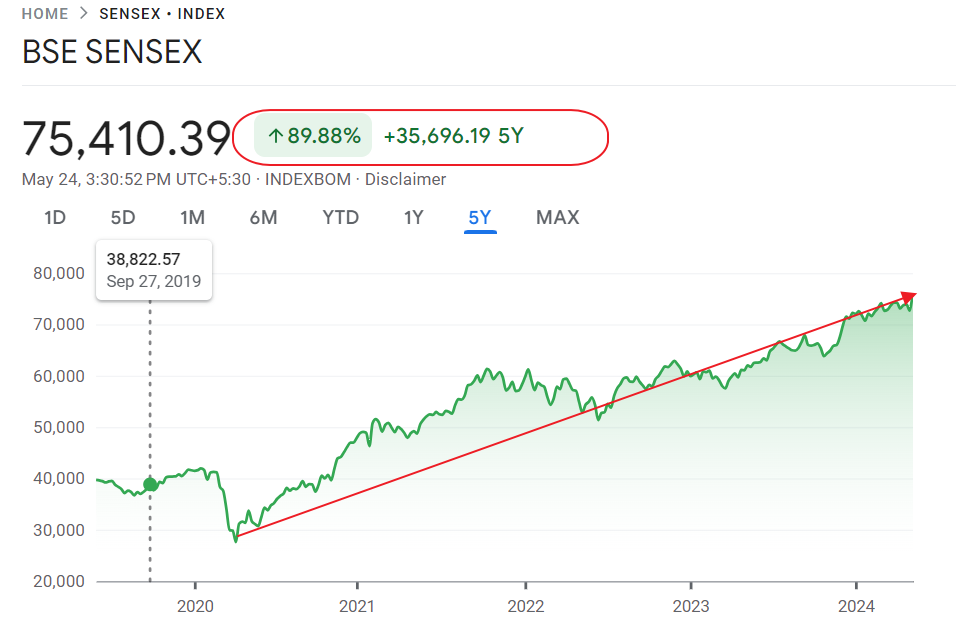
India’s Sensex is on a roll this year. The index is up by over 4% so far this year. Last week it reached an all-time high of 75,636 before closing at 75,410 on Friday. This is indeed amazing. The Sensex reached 10,000 in 2017. Since then it has crossed peak after peak. It reached 25,000 in 2014 and crossed 50,000 in 2021 on the back of strong recovery from the depths of the Covid-19 pandemic.
Currently India is in the midst of a national election and the results are expected on Tuesday, June 4th. It should be interesting to watch how the Sensex reacts and where it stands by the end of the year.
The following chart shows the YTD return of the Sensex:
Click to enlarge

The following chart shows the 5-year return of the Sensex:
Click to enlarge

Source: Google Finance
With the election results looming on the horizon and the market at record high, investors looking to invest in Indian equities can wait for the right opportunity.
For additional data on Sensex annual returns and a list of Sensex return charts click here.
Related ETFs and ETNs:
Disclosure: No positions


