Muslim Population in Canada: Infographic

The current population of Canada is about 40.0 million according according to Worldometer data. This represents 0.49% of the total world population. In terms of land size, Canada is the second largest in the world after Russia and ahead of the US. However much of the land is uninhabited and the majority of the population lives closer to the US border than in the reminder of the country.

Recently the population of Canada has grown more sharply relative to the US population growth rate as shown in the chart below:

Click to enlarge

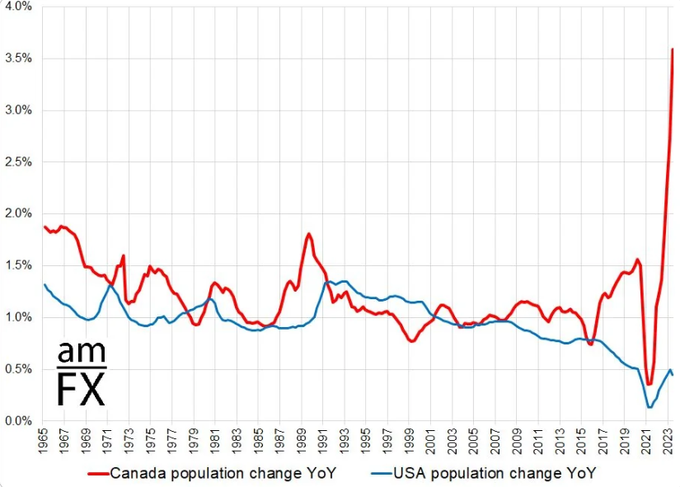
Source: via @@donnelly_brent

The Muslim population in Canada is small but growing according to a recent chart published by Statcan. From 2001 to 2021 the Muslim population in Canada more than doubled as shown in the below infographic:

Click to enlarge

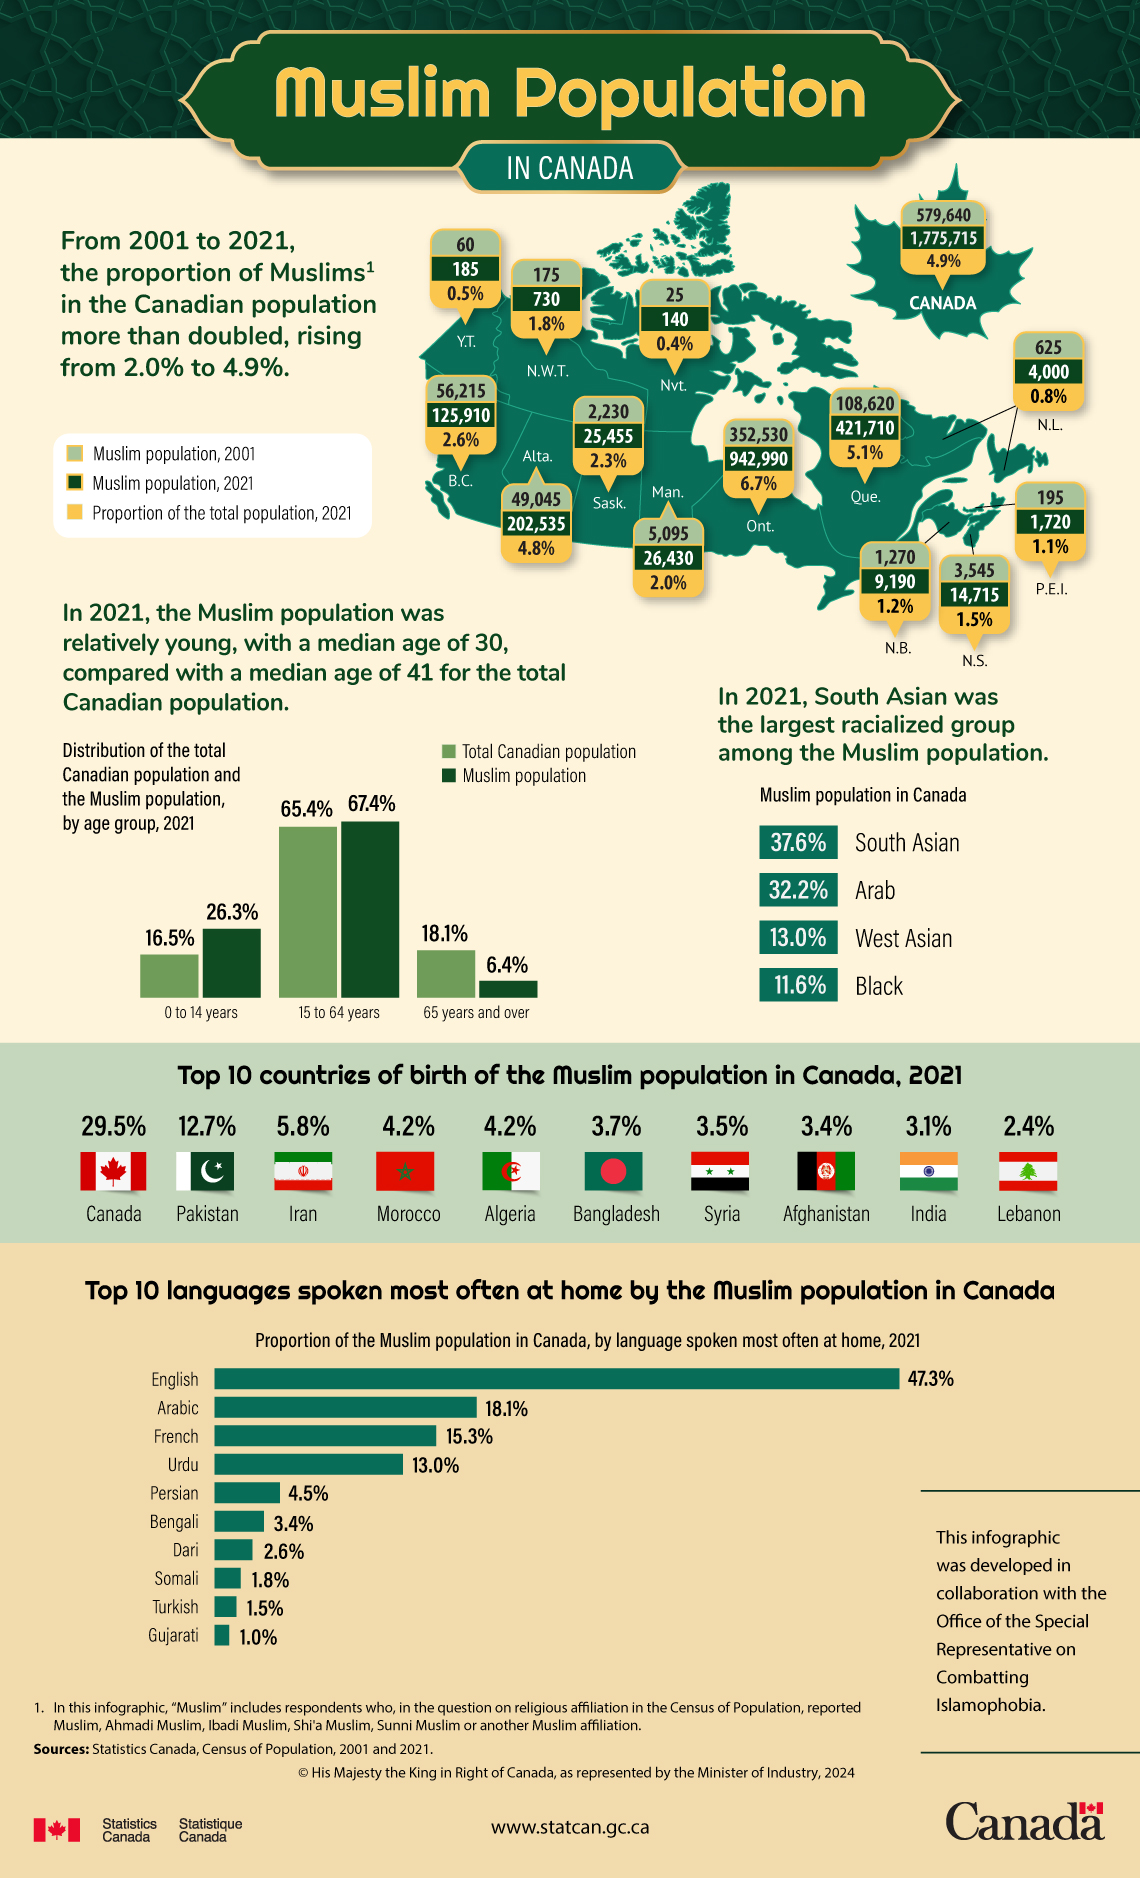
Source: Statistics Canada

In terms of absolute number, the Muslim population in Canada stood at about 1.8 million in 2021.

Public Sector Employment as a percentage of Total Employment in OECD Countries: Chart

Public Sector Employment as a percentage of Total Employment varies widely among OCED countries according to a working paper published by the OECD. The Scandinavian countries of Norway, Sweden and Denmark have the highest general government employment at close to 30% based on 2021 data. Japan and South Korea have the lowest government employment at less than 10% of total employment.

Among the OECD countries in the EU, Germany and the Netherlands have the lowest government employment at under 13%. The OECD average was about 18.6% in 2021. The US figure is lower than the OECD average at about 15% but higher than South Korea, Japan, Italy, etc.

The following chart shows Public Sector Employment as a percentage of Total Employment in OECD Countries based on the latest data available:

Click to enlarge

Source: Size and composition of public employment: data sources, methods and gaps, Working Paper, OECD

However Federal employees account for about 20% of the total government employees in the US. This shows that most of the government levels are in other levels of government like the state, country, city, etc.

Click to enlarge

Source: Size and composition of public employment: data sources, methods and gaps, Working Paper, OECD

It remains to be seen if public sector employment would decline significantly under the plans proposed by Elon Musk and Vivek Ramaswamy of DOGE in the upcoming Trump administration.

Comparing the Returns of Bitcoin and S&P 500 Index: Chart

Crypto currency Bitcoin has soared this year especially since the results of the US election were announced. Bitcoin prices recently reached an all-time of $108, 268 and today traded at over $94,000. In terms of returns, bitcoin has crushed the S&P 500 and other assets. In this post, let us take a look at a few charts comparing the returns.

The following chart shows the returns of Bitcoin vs. S&P 500 YTD:

Click to enlarge

Source: Statmuse

Bitcoin has returned 125% while the S&P 500 has returned 25% YTD.

The following table shows the returns of Bitcoin, Gold and S&P over different time periods:

Click to enlarge

Source: Casebitcoin

Average Electricity Price for Household Consumers in EU 2024: Chart

Electricity prices for households in the EU vary widely across countries. Germany has the highest prices while Turkey has the lowest price per kWH in the first half of this year according to a report in Deutsche Welle. Germans pay an average of 39.15 Euro center per kWH and Turks pay just 4.88 Euro center per kWH as the chart below shows. Germany’s Energiewende plan that was passed in 2010 and envisions a country heavily dependent renewable energy sources is part of the reason why electricity prices are so high in Europe’s largest economy. During winter the country’s renewable energy production becomes volatile due to reduced availability of sun and wind power.

Click to enlarge

Source: Is Germany to blame for rising electricity prices in Europe?, Deutsche Welle

Below is a brief excerpt from the article:

Renewables can add to instability

Germans have a word for a period where little or no energy can be produced because there is limited wind or sunlight: “Dunkelflaute” or “dark doldrums.”

The technical name is “anticyclonic gloom,” which doesn’t sound nearly as menacing, though experts cannot agree what exactly needs to happen to get this designation. 

Even if it is a slippery term, the phenomenon is serious. With lower renewable output, other sources of electricity need to be tapped, which can lead to short-term price spikes. Sometimes this means importing it from other countries.

Right now, the dark-doldrums effect is highly relevant for prices, “but for yearly averages it does not matter much,” said Mathias Mier, an economist at the Munich-based ifo Center for Energy, Climate and Resources

“In future, it might have more impact, but it is the role of governments and markets to steer the system into directions that minimize that impacts of ‘Dunkelflaute’,” he told DW.

Germany’s transition to renewable energy sources is a cautionary tale for other countries that plan such major initiatives. While in theory renewable energy sounds good and even noble, practical issues come into play especially during winter when energy needs are the highest. It remains to be seen if high energy prices continue to hurt the German economy and the overall European economy in general.