Fast Food is No Longer Cheap in the US: Chart

Fast food used to cheap in the US many years ago. That is no longer the case. Fast food which is basically “junk” and unhealthy food has become incredibly expensive in the past few years especially since the pandemic. Multiple factors have led to menu prices soaring. These include higher labor costs, inflation, rising food costs, increasing commercial rents, insurance costs, etc. I came across the following chart that shows how fast food prices have outpaced inflation since 2014:

Click to enlarge
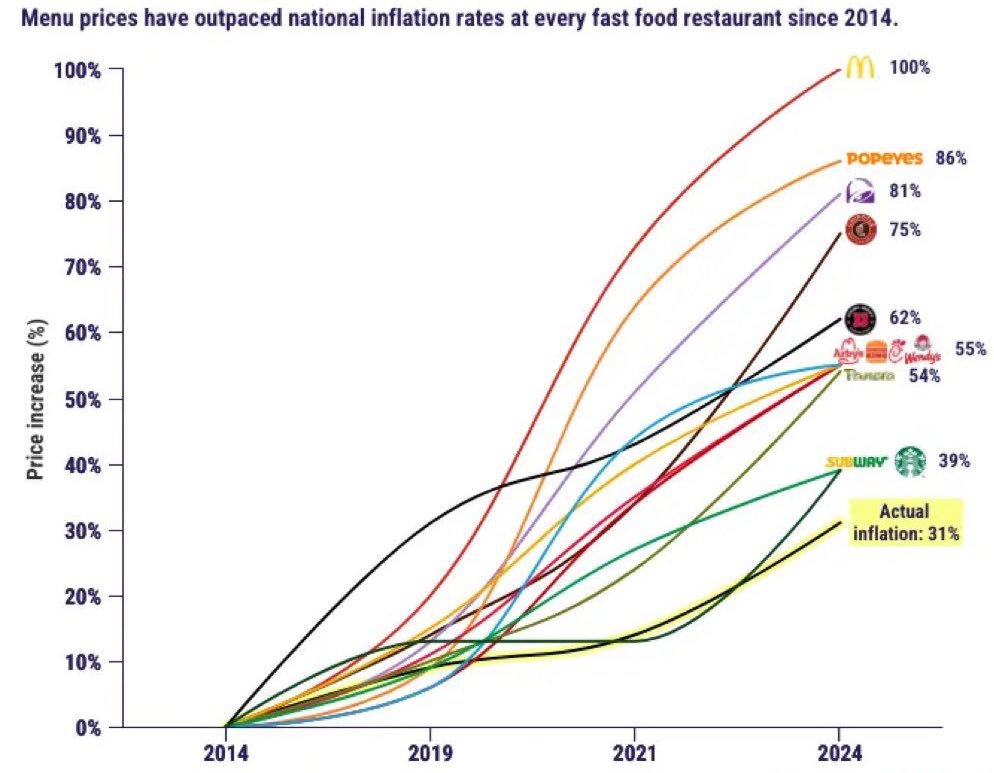
Source: @MichaelAArouet via syz Group

Higher food prices have not led to a significant decrease in sales among the major chains. However due to rising consumer backlash McDonald’s for instance is launching a $5 meal in June for a month. Burger King is also joining the battle with a $5 meal.

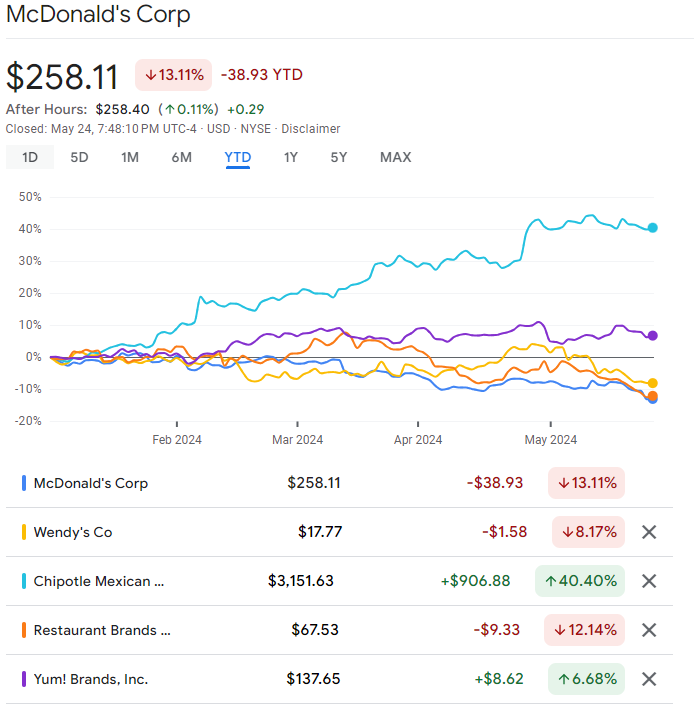
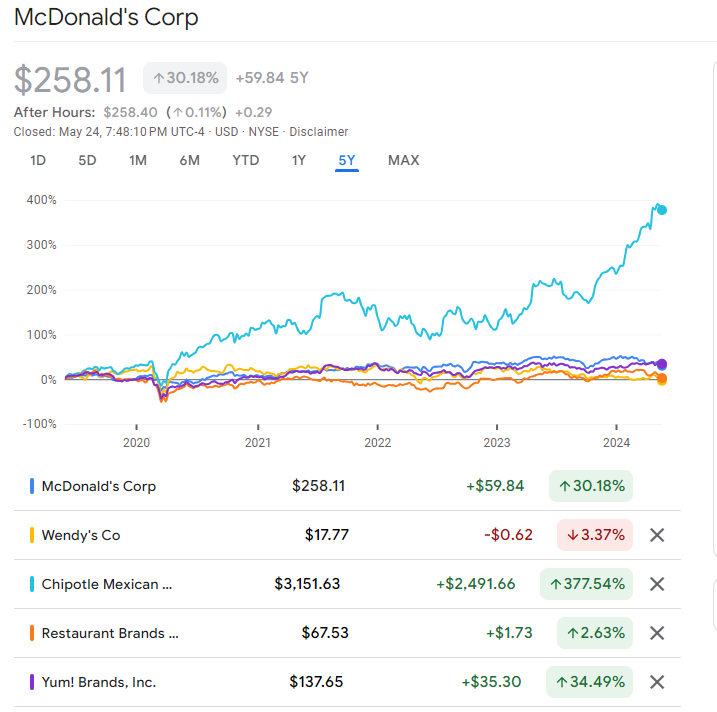
In terms of stock returns, Chipotle Mexican Grill(CMG) is the best performer YTD and also in the past 5 years as the charts below show:

Select fast-food restaurant stock returns YTD as of May 24, 2024:

Click to enlarge
Select fast-food restaurant stocks 5-returns as of May 24, 2024:

Click to enlarge
Source: Google Finance

Related Companies:

  • Chipotle Mexican Grill Inc. (CMG)
  • McDonald’s Corporation (MCD)
  • Restaurant Brands International Inc.(QSR)
  • Wendy’s Company (The) (WEN)
  • Yum! Brands Inc. (YUM)

Disclosure: No positions
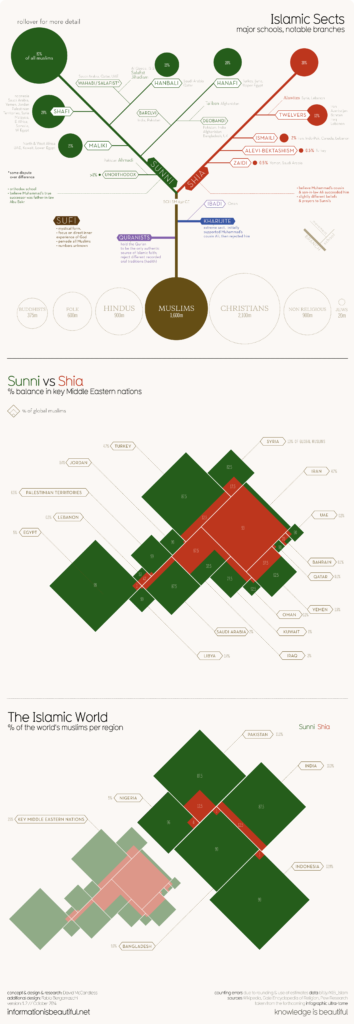
Islamic Sects – Major Schools and Notable Branches: Infographic

Islam is the second largest religion in the world after Christianity. Around 1.8 billion people are followers of Islam. Indonesia has the largest number of followers followed by Pakistan and India. Similar to other religions, Islam also has multiple sects and sub-sects with Shia and Sunni being the major sects. Recently I came across the below infographic that shows many interesting details about Islam:

Click to enlarge

Source: Information is Beautiful

Average Annual Hours Worked by Workers in OECD Country in 2022 or Latest: Chart

The average hours worked per year for countries was published by OECD recently. According to their date, the Colombian worker worked the most at over 2,405 hours per year. The average American worked just over 1,810 hours per year. The EU average was 1,570 hours. Germany had the lowest hours per worker at 1,340 hours per year.

Click to enlarge

Source: Have the Germans become lazy at work?, Deutsche Welle

A German study disputes the OECD findings arguing that instead of less work actually more work is being done by a German worker and the female participation in the labor force is also the highest over the past 30 years.

Comparing Ferrari’s Profit Per Unit to Other Auto Makers

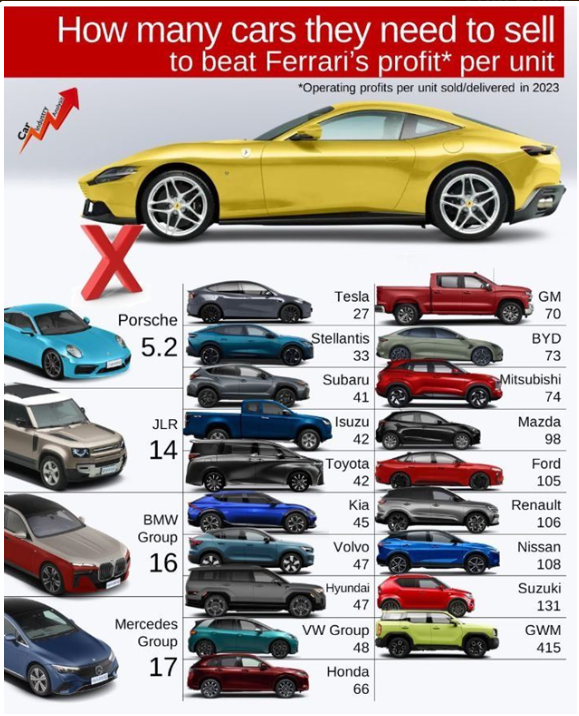
Italian luxury auto maker Ferrari NV (RACE) is the most profitable automaker in the world. In 2023, the company shipped out just 13,663 vehicles. Total revenue in that year was 5.97 billion Euros with a profit of 1.257 billion Euros. According to industry analyst Felipe Munoz, the operating profit for each car was an astonishing 117,927 Euros. Ferrari’s net profit margin in 2023 was 21.42%.

Here is a breakdown of operating profit per unit of other automakers as calculated by Felipo Munoz of Car Expert of Australia:

Note: The figures below are in Australian $s.

ManufacturerUnits sold (global)Profits per unit  (approx. AUD)
Ferrari13,663$192,221
Porsche320,221$37,078
Jaguar Land Rover (JLR)420,584$13,871
BMW (incl. Mini)2,253,835$11,793
Mercedes-Benz2,043,800$11,395
Tesla1,808,581$7249
Stellantis6,175,000$5906
Subaru912,452$4661
Isuzu770,000$4605
Toyota (incl. Lexus, Daihatsu, Hino)11,230,000$4530
Kia3,085,771$4283
Volvo708,716$4117
Hyundai4,216,680$4083
Volkswagen Group (incl. PorscheAudiSkoda)9,240,000$3981
Honda3,700,000$2892
General Motors6,200,000$2765
BYD3,024,417$2618
Mitsubishi626,500$2608
Mazda1,244,613$1954
Ford4,400,000$1823
Renault1,548,748$1812
Nissan3,374,271$1773
Suzuki213,320$1463
GWM1,230,000$462
Aston Martin6620-$31,554

Source: Ferrari’s profit per vehicle puts every other brand in the shade, Car Expert

The below cool infographic shows how many units other auto manufacturers have to sell to beat Ferrari’s profit per unit:

Click to enlarge

Source: @MichaelAArouet via syz Group

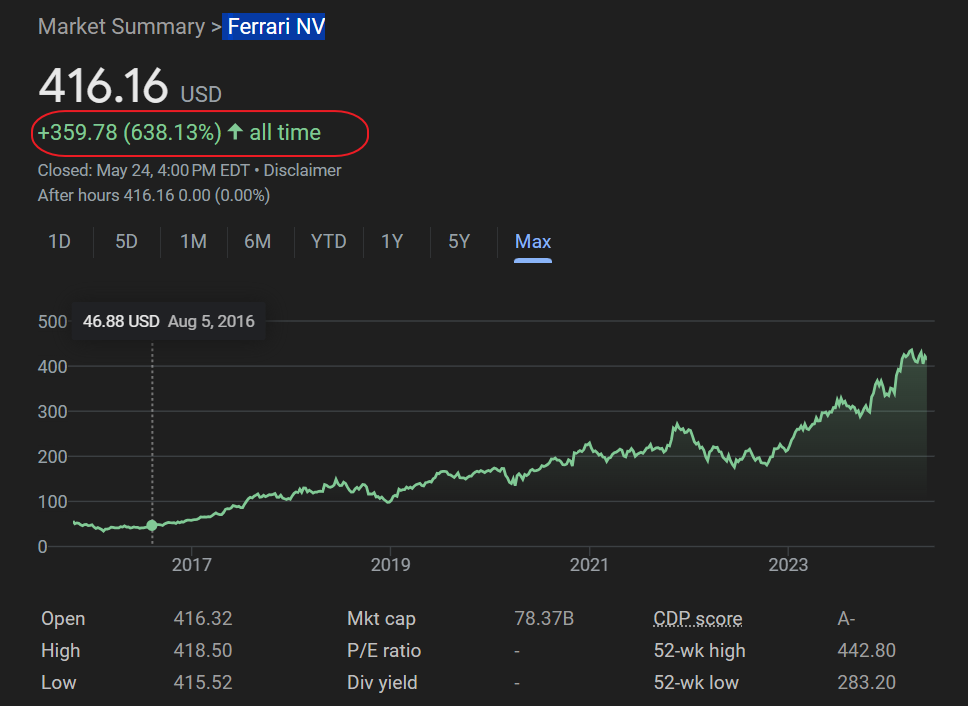
Ferrari listed its stock on the NYSE in Oct, 2015. Since then the stock has soared by over 638% as the chart shows below:

Source: Google Finance

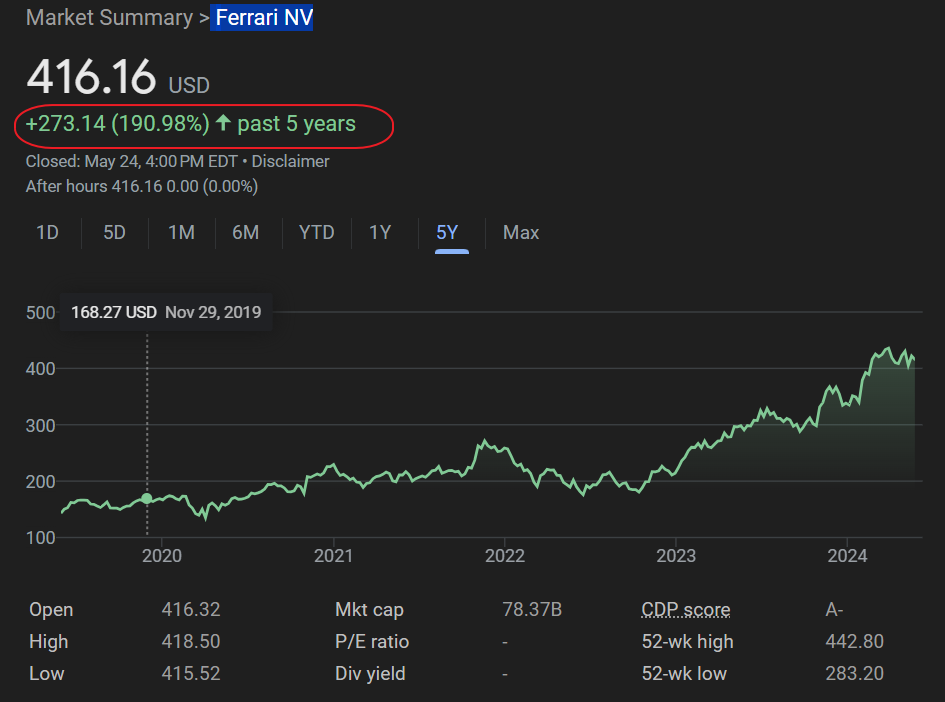
The following chart shows the 5-year returns:

Source: Google Finance

Currently Ferrari has a market cap of $78 billion. This is higher than the market caps of Stellantis N.V(STLA) and General Motors Co (GM).

Investors who got in on the IPO or even picked up the stock in the past few years have enjoyed excellent returns.

Disclosure: No positions