Top 20 Kazakhstan Companies by Market Capitalization

Kazakhstan became an independent country in 1991 after the breakup of the Soviet Union. It is the ninth largest country in the world and is bigger in size than Western Europe.

Unlike other natural resources-based economies, Kazakhstan is unique in that 99 of the 110 elements in the Periodic Table of the Elements are present in the country. Oil, gas, uranium, zinc, tungsten, barium, silver, lead, chrome, copper, fluorites, molybdenum, and gold are some of the resources that are currently being extracted from the land. In fact, the country’s vast mineral resources is estimated to be valued at over US$46.0 Trillions.

As an investment destination Kazakhstan is the wild west of the frontier markets and is slowly gaining the attention of international investors. Kazakh companies are not yet easily accessible to foreign investors as most of them are not traded on the major global exchanges. Fellow blogger and fund manager Roger Nusbaum has written about the country a few times. From one of his article last month:

The email in question shared news that many state owned companies will soon be sold into the market in a similar manner as many of the large Chinese companies, at least that is how I read it. Some companies mentioned were Air Astana, KEGOC which operates the electric grid, KazTransOil an oil pipeline company, KazTransGas a gas pipeline company, Kazmortransflot a shipping company, Samruk-Energo which generates power, Kazakhstan Temir Zholy a railroad operator and Kazatomprom a uranium miner. There are also a few materials companies that have been trading on other markets for a while with Kazakhmys (KZMYF) the one name most likely to be familiar. Kazakh Telecom appears to have a listing in France, but not on the US pinks, but it appears to have not traded since February. Kazmunaigas is also included in the announcement but it has shares trading on the AMEX; they’ve not done too well.

The ETF provider Global X filed for a country fund for Kazakhstan in July. But it is not clear when the ETF will actually be listed.

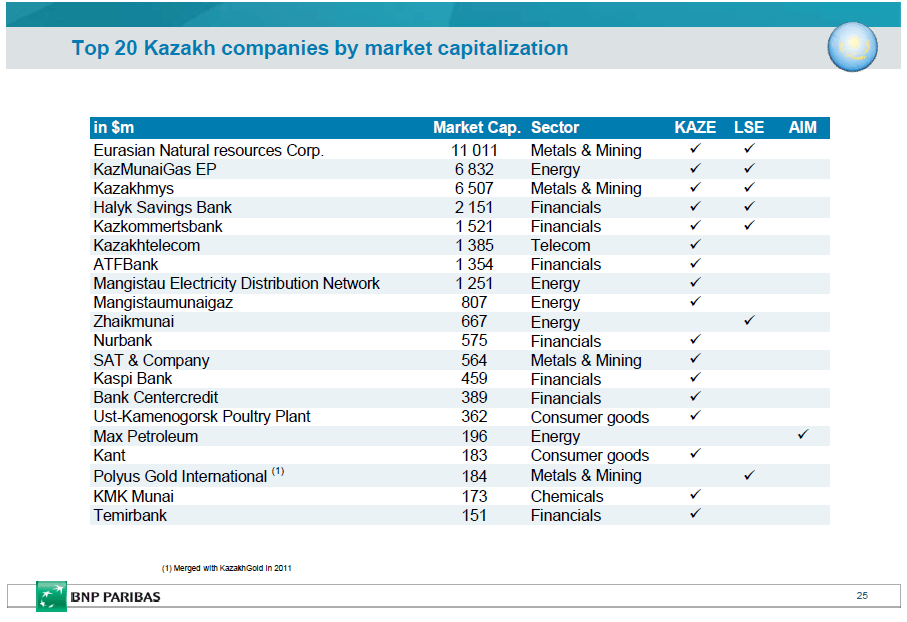
The Top 20 Kazakh Companies by Market Capitalization

Click to enlarge

Source: The attractiveness of the Kazakhstan Market, BNP Pribas

Two of the above companies trading on the London Stock Exchange(LSE) are Eurasian Natural Resources Corporation PLC (ENRC.L) and Kazakhmys PLC (KAZ.L). Polyus Gold International Limited GDR trades on the pink sheets under the ticker PLZLY.PK.

Related Links:

Kazakhstan Stock Exchange (KASE)

Also checkout:

Disclosure: No Positions

USA Has One of the Lowest Taxes Among OECD Countries

The current U.S. total public debt outstanding exceeds $14.8 Trillions. This huge debt has been accumulated over many years under the of administrations of both Republican and Democratic presidents.

Just like a business it takes money to run a government. One of the main sources of revenue for governments is taxes. So Tax Revenues as a percentage of GDP is an ideal measure to determine if a country’s tax collections is high or low. Based on this measure, the U.S. ranks lowest among most of the developed countries.

According to a recently released OECD report, the Tax Revenues as a percentage of GDP for the US was just 24% in 2009, the latest year for which data is available. This is lower than most other developed nations with sample countries like Denmark at 48.2%, UK at 34.3%, Canada at 31.1%, etc. Of course, higher taxes collected by these countries helps pay for generous benefits to citizens such as free high-quality healthcare for all, education, unemployment insurance, etc.

Until now the lower tax rate regime in the U.S. worked fine since the economy was mostly growing and a lower percentage of the population was dependent on the state for survival. However that scenario has changed dramatically in the past few years due to the sluggish economy. The U.S. Federal government’s tax revenues as a percentage of the GDP has for the most part stayed at around around 20% or lower while expenditures have increased due to wars, soaring healthcare costs, social security and other entitlement programs. Hence unlike other developed countries, in the U.S. the gap between tax revenues and expenditures is widening at an alarming rate. With both the parties unable to increase taxes or decrease expenditures substantially, the situation is bound to get worse in the future.

The table below lists Tax Revenues as a percentage of GDP for OECD countries:

[TABLE=1046]

Source: OECD

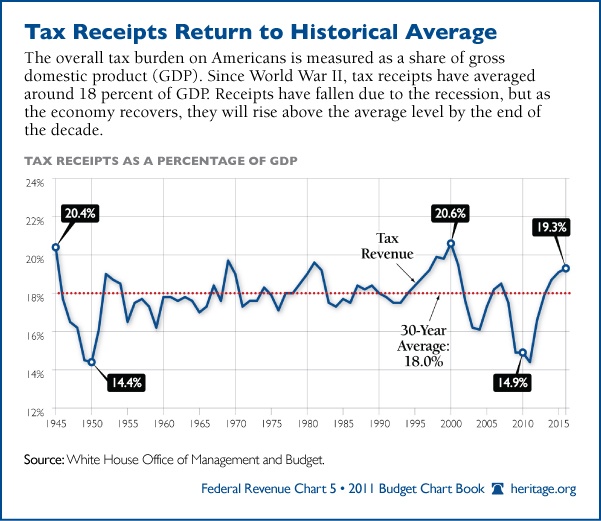
The following graph shows the U.S. Tax Revenues as a percentage of GDP from a historical perspective:

Click to enlarge

Source: 2011 Budget Chart Book, The Heritage Foundation

The Global Too-Big-To-Fail Banks

Many large U.S. banks were bailed out with tax payers’ funds during the Global Financial Crisis (GFC). Since then these banks have gotten even bigger by acquisitions and decline in competition as struggling smaller banks are left to fail by Uncle Sam. These small group of elite institutions aka known as “Systemically Important Financial Institutions” (SIFIs) are now required to hold more capital as a percentage of assets because of the Dodd-Frank law. This extra capital has come to be known as the “SIFI surcharge” in the industry.

According to an article in The Wall Street Journal recently the global equivalent of this charge is expected to confirmed by the G-20 leaders when they meet in Cannes, France next month.

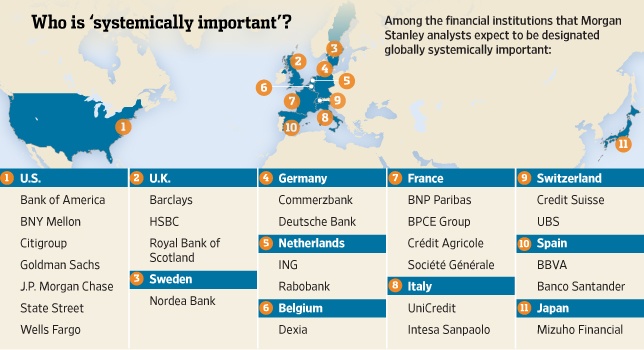
So what are some of the Global Too-Big-To-Fail(TBTF) Banks?

Click to enlarge

Source: Big Banks Find No Comfort in Capital Cushion

Dexia is a French-Belgian bank that is on the verge being dismantled by France and Belgium. From an investment perspective investors may consider adding Sweden-based Nordea Bank (NRBAY). It has a dividend yield of over 5%. While states may declare these banks as TBTF banks it does not mean investors can invest in their common stocks without any worry of getting wiped out. Germany’s Commerzbank (CRZBY), UK’s Royal Bank of Scotland (RBS), etc. may still fail and equities can become worthless but the banks themselves will not disappear completely. They may be merged with other larger peers or reorganized in a different shape.

Disclosure: Long CRZBY, STD, ING,RBS, SCGLY, BBVA

Which Country is a Better Investment: Brazil or India ?

The emerging markets of Brazil and India are vastly different in many ways. Brazil is not only blessed with many natural resources that the world wants but is also increasingly becoming as an exporter of manufactured goods. But Brazil has a small population compared to India.

India on the other hand has limited natural resources but traditionally has had a large manufacturing sector. With a huge population India offers bigger market for growth.

For foreign investors, both the countries offer a wide variety of choices for investment from banking to consumer goods to real estate sectors. However the Brazil is ahead of India in terms of equity market performance based on the MSCI country indices.

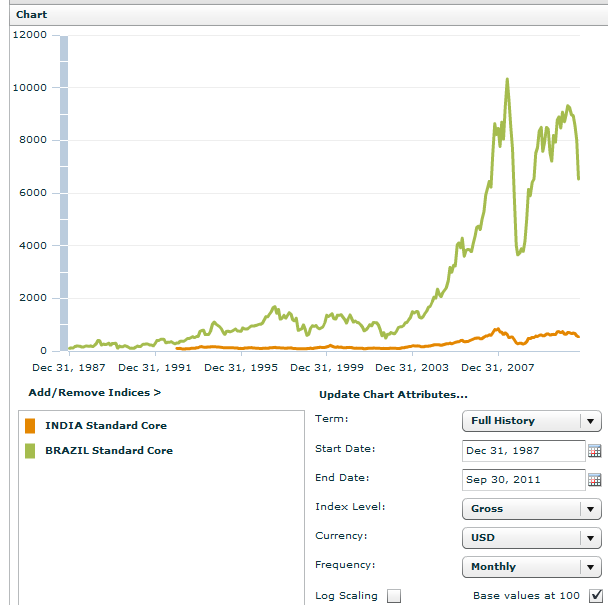
Multi-year performance of MSCI India and Brazil indices:

Click to enlarge


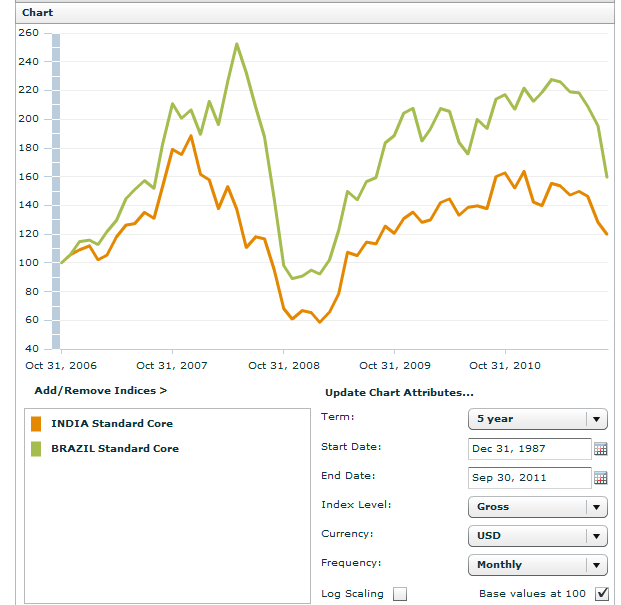
5-year performance of MSCI India and Brazil indices:

Source: MSCI

The long-term performance of Brazil and India are incomparable as shown in the first chart. One reason for this huge gap between them could be that India adopted free-market economic policies only in the 1990s and for many years even after that discouraged foreign investment in a number of key sectors of the economy.

The 5-year chart shows that the equity market performance of Brazil and India tracked each other though Indian stocks always lagged. Brazilian stocks fell heavily at the height of the credit crisis in 2009, but have recovered better than Indian stocks.

The equity market performance of the next five years will be closely watched by investors as both countries are projected to have strong economic growth and continue to attract high foreign direct investment. Since each country has its own unique risks and certain sectors offer higher potential for growth than others, investors must evaluate and invest in individual companies (or) sectors rather than simply going with country-specific funds.

Related ETFs:
EGShares India Infrastructure ETF (INXX)
EGShares Brazil Infrastructure ETF (BRXX)
iShares MSCI Brazil Index (EWZ)
Market Vectors India Small-Cap Index ETF (SCIF)
WisdomTree India Earnings (EPI)
PowerShares India (PIN)
iShares S&P India Nifty 50 (INDY)

Disclosure: No positions

IMF: Income Inequality Worsens in Most Developed Countries

Originally I had scheduled the article below for posting on next Friday. After reading yesterday’s The New York Times editorial on Occupy Wall Street protests I decided to publish it today.

From the Times editorial:

Extreme inequality is the hallmark of a dysfunctional economy, dominated by a financial sector that is driven as much by speculation, gouging and government backing as by productive investment.

When the protesters say they represent 99 percent of Americans, they are referring to the concentration of income in today’s deeply unequal society. Before the recession, the share of income held by those in the top 1 percent of households was 23.5 percent, the highest since 1928 and more than double the 10 percent level of the late 1970s.

That share declined slightly as financial markets tanked in 2008, and updated data is not yet available, but inequality has almost certainly resurged. In the last few years, for instance, corporate profits (which flow largely to the wealthy) have reached their highest level as a share of the economy since 1950, while worker pay as a share of the economy is at its lowest point since the mid-1950s.

Income gains at the top would not be as worrisome as they are if the middle class and the poor were also gaining. But working-age households saw their real income decline in the first decade of this century. The recession and its aftermath have only accelerated the decline.

Research shows that such extreme inequality correlates to a host of ills, including lower levels of educational attainment, poorer health and less public investment. It also skews political power, because policy almost invariably reflects the views of upper-income Americans versus those of lower-income Americans.

Original Article:

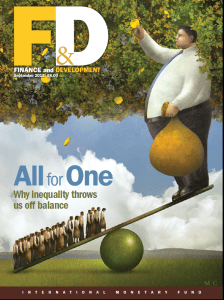
The latest edition of IMF’s Finance & Development magazine is mainly focuses on Income Inequality and its impacts. One can gain a wealth of knowledge from reading many of the articles related to this topic in this excellent issue.

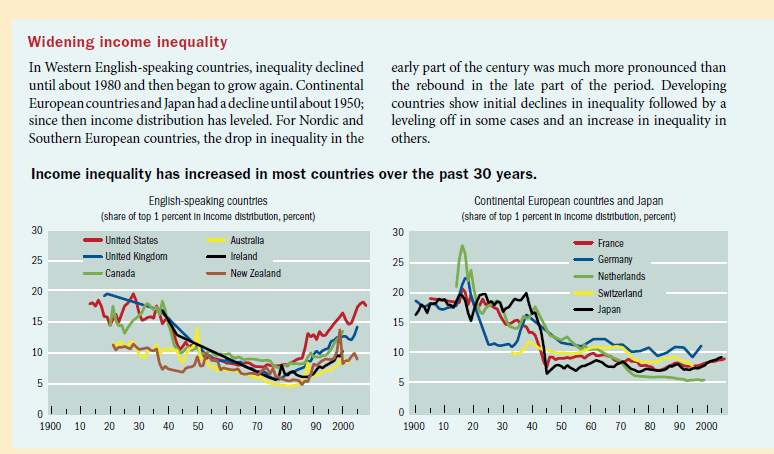
Income inequality declined in the first half of the 20th century. But it is making a comeback in most of the countries around the world. This is especially striking in the case of developed world where income inequality has increased in the past 30 years.


Click to enlarge

In the beginning of the 20th century, the top 1 percent of earners were capital owners. But by the end of the century the hired hands  – the top executives of corporations – shared the biggest share of the income distribution with capital owners. In this U.S., this setup continues to worsen as shown in the chart below:


Unlike some of the original capitalists like J.P. Morgan, David Rockefeller or Andrew Carnegie, today’s top executives do not invest their own capital and take huge risks to accumulate the outsized rewards. Instead fabulous wealth are legally transferred from companies to the pockets of these executives on a daily basis supposedly for their magical talent. Some examples of this modern-day “capitalists” with outlandish compensation in 2010 include Philippe P. Dauman of Viacom with $84.5 million, Ray R.Irani of Occidental Petroleum with $76.1 million, Lawrence J.Ellison of Oracle with $70.1 million, etc. (Source: The Pay at the Top, New York Times).

Update: Yesterday Bank of America (BAC), the Too-Big-To-Fail bank that still survives, announced that it will pay Sallie L. Krawcheck, the fired wealth-management division head a sum of $6 million. This latest scam case illustrates how the same banks that triggered the credit crisis and were bailed out by the state have not learned a single thing from their own near-death experience.

From the F&D article Inequality over the Past Century:

The dramatic increase in recent decades in the share of income going to the top 1 percent in many countries is due to a partial restoration of capital incomes and, more significantly, to very large increases in compensation for top executives. In the United States, as a result, the working rich have joined capital owners at the top of the income hierarchy.

In the United States, average real incomes grew at a 1.3 percent annual rate between 1993 and 2008. But if the top 1 percent is excluded, average real income growth is almost halved, to about 0.75 percent a year. Incomes of the top 1 percent grew 3.9 percent a year, capturing more than half of the overall economic growth experienced between 1993 and 2008. During the expansions of 1993–2000 and 2001–07, the income of the top 1 percent grew far more quickly— at an annual rate of more than 10.3 percent and 10.1 percent, respectively—than that of the bottom 99 percent, whose incomes grew at a 2.7 percent annual rate in the earlier expansion and 1.3 percent in the later one.

What is Kuznets Curve?

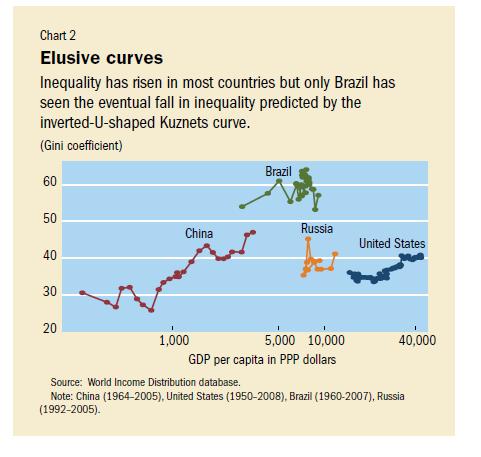
The Kuznets curve, formulated by Simon Kuznets in the mid-1950s, argues that in preindustrial societies, almost everybody is equally poor so inequality is low. Inequality then rises as people move from low-productivity agriculture to the more productive industrial sector, where average income is higher and wages are less uniform. But as a society matures and becomes richer, the urban-rural gap is reduced and old-age pensions, unemployment benefits, and other social transfers lower inequality. So the Kuznets curve resembles an upside-down “U.”

Based on the Kuznets curve theory also “the United States—the richest large country in the world—is one paradigmatic case of rising inequality” according to another article in the magazine. As China’s economy was liberalized in 1978, inequality surged and eventually surpasses that of the U.S. as shown in the chart below:

Source: Finance & Development, September 2011, IMF

Disclosure: No positions