Ten Foreign Utility Stocks To Consider

Utility stocks are generally considered to be defensive stocks. However in recent years they have been volatile and many have not recovered fully from the March 2009 lows.

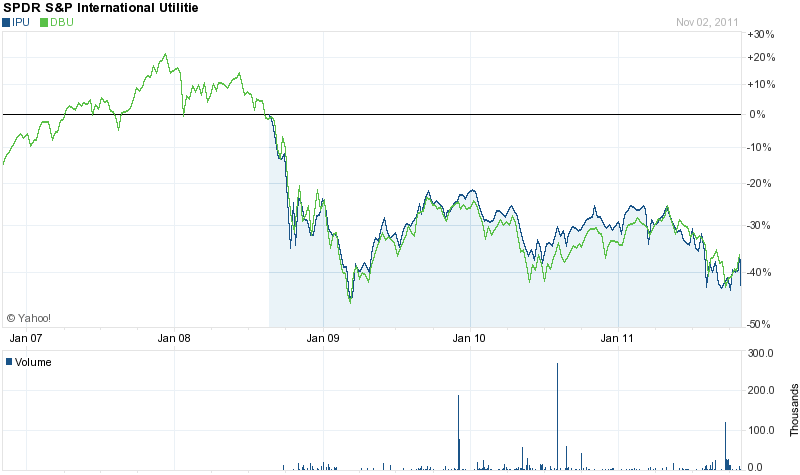
The following chart shows the relative performance of SPDR S&P International Utilities Sector ETF (IPU) and WisdomTree Global ex-US Utilities ETF (DBU):

Click to enlarge


Both these ETFs offer easy access to invest in foreign utilities with the WidsomTree and SPDR funds currently having dividend yields of 4.91% and 5.34%  respectively.

nvestors looking to invest directly in individual foreign utilities trading on the organized exchanges have a only few options available. But many more companies trade on the OTC markets.  The following is a list of ten foreign utility ADRs trading under $10  for further review:

1.Company: Empresa Distribuidora Y Comerci (EDN)
Current Price: $8.20
Current Dividend Yield: N/A
Country: Argentina

2.Company: Enel Spa (ENLAY)
Current Price: $4.46
Current Dividend Yield: 6.00%
Country: Italy

3.Company: Electricite de France SA (ECIFY)
Current Price: $5.75
Current Dividend Yield: 5.61%
Country: France

4.Company: Verbund (OEZVY)
Current Price: $5.71
Current Dividend Yield: 2.69%
Country: Austria

5.Company: SNAM Rete Gas SpA (SNMRY)
Current Price: $9.22
Current Dividend Yield: 2.69%
Country: Italy

6.Company: Red Electrica (RDEIY)
Current Price: $9.28
Current Dividend Yield: 8.30%
Country: Spain

7.Company: Gas Natural (GASNY)
Current Price: $3.35
Current Dividend Yield: N/A
Country: Spain

8.Company: EVN AG (EVNVY)
Current Price: $3.00
Current Dividend Yield: 3.85%
Country: Austria

9.Company: Fortum Oyj (FOJCY)
Current Price: $4.67
Current Dividend Yield: $6.19%
Country: Finland

10.Company: Centrais Eletricas Brasileiras-Eletrobras (EBR)
Current Price: $9.90
Current Dividend Yield: N/A
Country: Brazil

Note: Prices and Dividend Yields changes noted are as of market close Nov 2, 2011.

Disclosure: No Positions
The Five Best and Worst Performing Latin American ADRs YTD

Most of the emerging market equity indices are down so far this year. In addition to domestic factors, the European debt crisis and worries about the state of the global economy have pulled down emerging markets. Emerging markets such as Brazil, Peru and Chile are off by double digits YTD. The MSCI index returns for select Latin American countries are listed below:

Brazil: -17.07%
Chile: -14.49%
Colombia: -2.78%
Mexico: -9.69%
Peru: -21.42%

Source: MSCI Barra

Due to the decline in prices some of the Latin American stocks are looking attractive at current levels. Hence investors looking to add exposure to this region can take advantage of the cheap prices now. To get started here is the list of the five best and worst performing Latin American ADRs trading on the organized exchanges.

The five best performing exchange-listed Latin American ADRs YTD:

1.Company: BRF – Brasil Foods (BRFS)
Current Price: $21.05
YTD Change: 24.70%
Country: Brazil

2.Company: Fomento Economico Mexicano (FMX)
Current Price: $67.05
YTD Change: 19.90%
Country: Mexico

3.Company: Telefonica Brasil (VIV)
Current Price: $29.02
YTD Change: 18.59%
Country: Brazil

4.Company: Companhia Energetica de Minas Gerais-CEMIG (CIG)
Current Price: $14.10
YTD Change: 12.98%
Country: Brazil

5.Company: Ultrapar (UGP)
Current Price: $17.76
YTD Change: 9.90%
Country: Brazil

The five worst performing exchange-listed Latin American ADRs YTD:

1.Company: Maxcom Telecomunicaciones (MXT)
Current Price: $1.40
YTD Change: -62.16%
Country: Mexico

2.Company: Banco Macro (BMA)
Current Price: $20.05
YTD Change: -60.06%
Country: Argentina

3.Company: Cemex (CX)
Current Price: $4.37
YTD Change: -57.57%
Country: Mexico

4.Company: Desarrolladora Homex (HXM)
Current Price: $14.96
YTD Change: -55.75%
Country: Mexico

5.Company: Gafisa (GFA)
Current Price: $7.44
YTD Change: -48.70%
Country: Brazil

Note: Prices and YTD changes noted are as of market close Oct 31, 2011.

Disclosure: Long UGP, BMA

Importance of Foreign Banks to Select Emerging Countries and Vice Versa

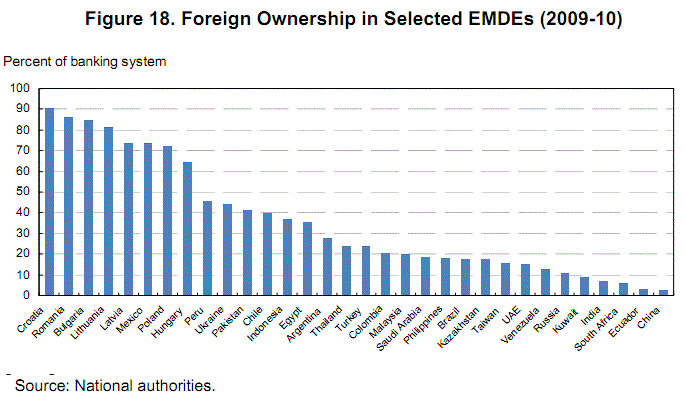
Foreign banks have a strong presence in some emerging countries. In a few of those countries they dominate the local banking market more than the domestic banks.

The following chart shows the foreign ownership in select Emerging Market and Developing Economies (EMDEs):

Click to enlarge


It is interesting to note that foreign banks own more than 50% of the market share in the Central and East European countries noted above. Some of the foreign banks with heavy exposure to these countries include Austria’s Erste Bank (EBKDY) and Raiffeisen Bank (RAIFY) , France’s Societe Generale (SCGLY), Holland-based ING Group (ING), etc. However in the BRIC countries they account for a small part of the total banking system.

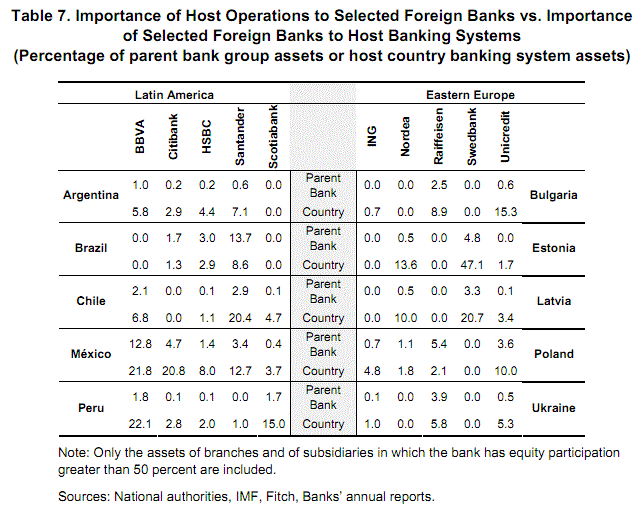
The following graphic shows the importance of select foreign banks to the host banking system and vice versa:

Source: Won’t somebody think of the emerging sovereigns?, FT Alphaville

From the FT Alphaville article:

Argentina, Chile and Mexico have big “exposure” to Santander, but each country is a relatively small proportion of the bank’s own assets. On the other hand, Brazil’s importance to Santander, far outweighs the reverse.

Over in Europe look at, say, Bulgaria and Unicredit, or Latvia and Nordea. Or Peru and Scotiabank… in all these cases, the bank accounts for 10 to 15 per cent of the host country’s banking system assets.

From an investment perspective, because some of these banks have high exposure to emerging markets, their earnings are more diversified and may be better investment options than banks that solely focus on the home markets.

Disclosure: Long BNS, ING, SCGLY, EBKDY, SAN

Commodity Bear Markets Since 1975

Commodities have become an attractive asset class to ordinary investors in the past few years. Heavy marketing by Wall Street firms and the dismal economic situation have made investors turn to commodities for higher returns. However unlike other assets, commodities are extremely volatile, unpredictable and are affected by a multitude of factors that are difficult to evaluate. For example, while it easy for an ordinary investor to bet on Wheat, Corn or Crude Oil understanding the dynamics of those markets such as the concept of Contango are not easy.Similar problem exists with other commodities such as metals like steel and precious metals like Gold, Silver, Platinum, etc.

Before jumping into commodities investors have to understand the risks involved and realize that commodity prices can move violently up or down within a short period of time.

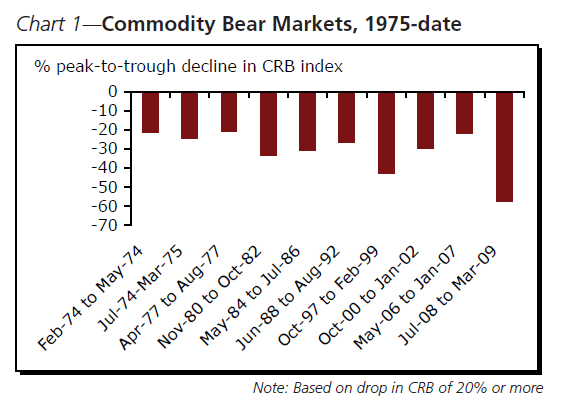
The following chart shows the bear markets in commodities since 1975:

Source: Commodities: Canaries in the Global Economic Mineshaft, CIBC Commodities Update

From the CIBC report:

There have been 10 bear resource markets in the last 35 years, lasting about 16 months on average. Including 2008-09’s particularly savage retreat, those episodes have seen prices drop by about 30% on average, on a peak-to-trough basis, half again the scale of the recent pullback.

Some related ETFs:

ProShares Ultra Oil & Gas (DIG)
United States Natural Gas Fund LP (UNG)
iShares Silver Trust (SLV)
The Teucrium Corn ETF (CORN)

Disclosure: No Positions

Why The West Needs China More Than The Other Way Around

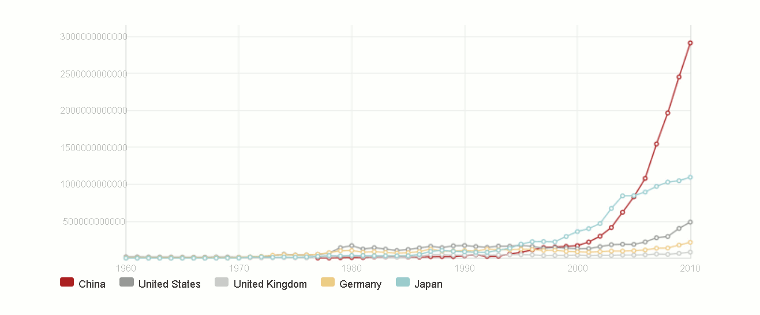
The European Union has sought China for help with solving the current debt crisis. The Europeans are asking the Chinese to invest in a fund setup as part of the European Financial Stability Facility (EFSF) program. Negotiations are underway between the two parties as the Chinese are keen to take advantage of the opportunity but want to make sure that they are getting a better deal on their investments.

The following graphic shows why China is in a better position to lend compared with select developed countries:

Click to enlarge

Note: Please excuse the quality of the chart.

Source: Chart of the Day: why Europe really, really needs China,  CityWire, UK

It is not just the EU that is currently dependent on China to solve fiscal issues. As the world’s largest debtor nation, the U.S. also depends heavily on China to sell its debt. China remains the largest foreign holder of U.S. debt with total holdings exceeding $1.2 Trillion.

The economies of the developed world remain in contraction mode now and are projected to under-perform emerging economies over the next few years. Hence debt crises and other issues can occur again in the developed world. As a result it is safe to say that the West needs China more than China needs the West.