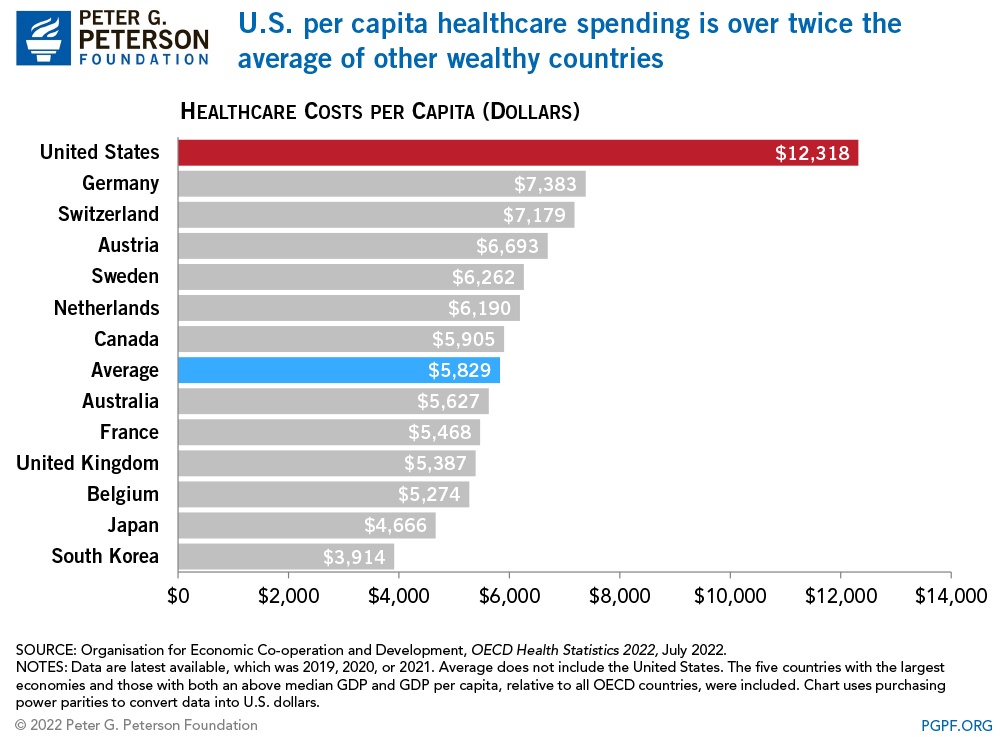
Healthcare spending in the US is the highest in the world. On a per capita basis the US spends more than any other OECD country as the below chart shows.
In 2021, the US spent $12,318 per per person in healthcare spending. The second highest among OECD countries was Germany at $7,383 followed by Switzerland. The OECD average excluding the USA was $5,829 per person. Hence the US spending was more than double that of the OECD average.
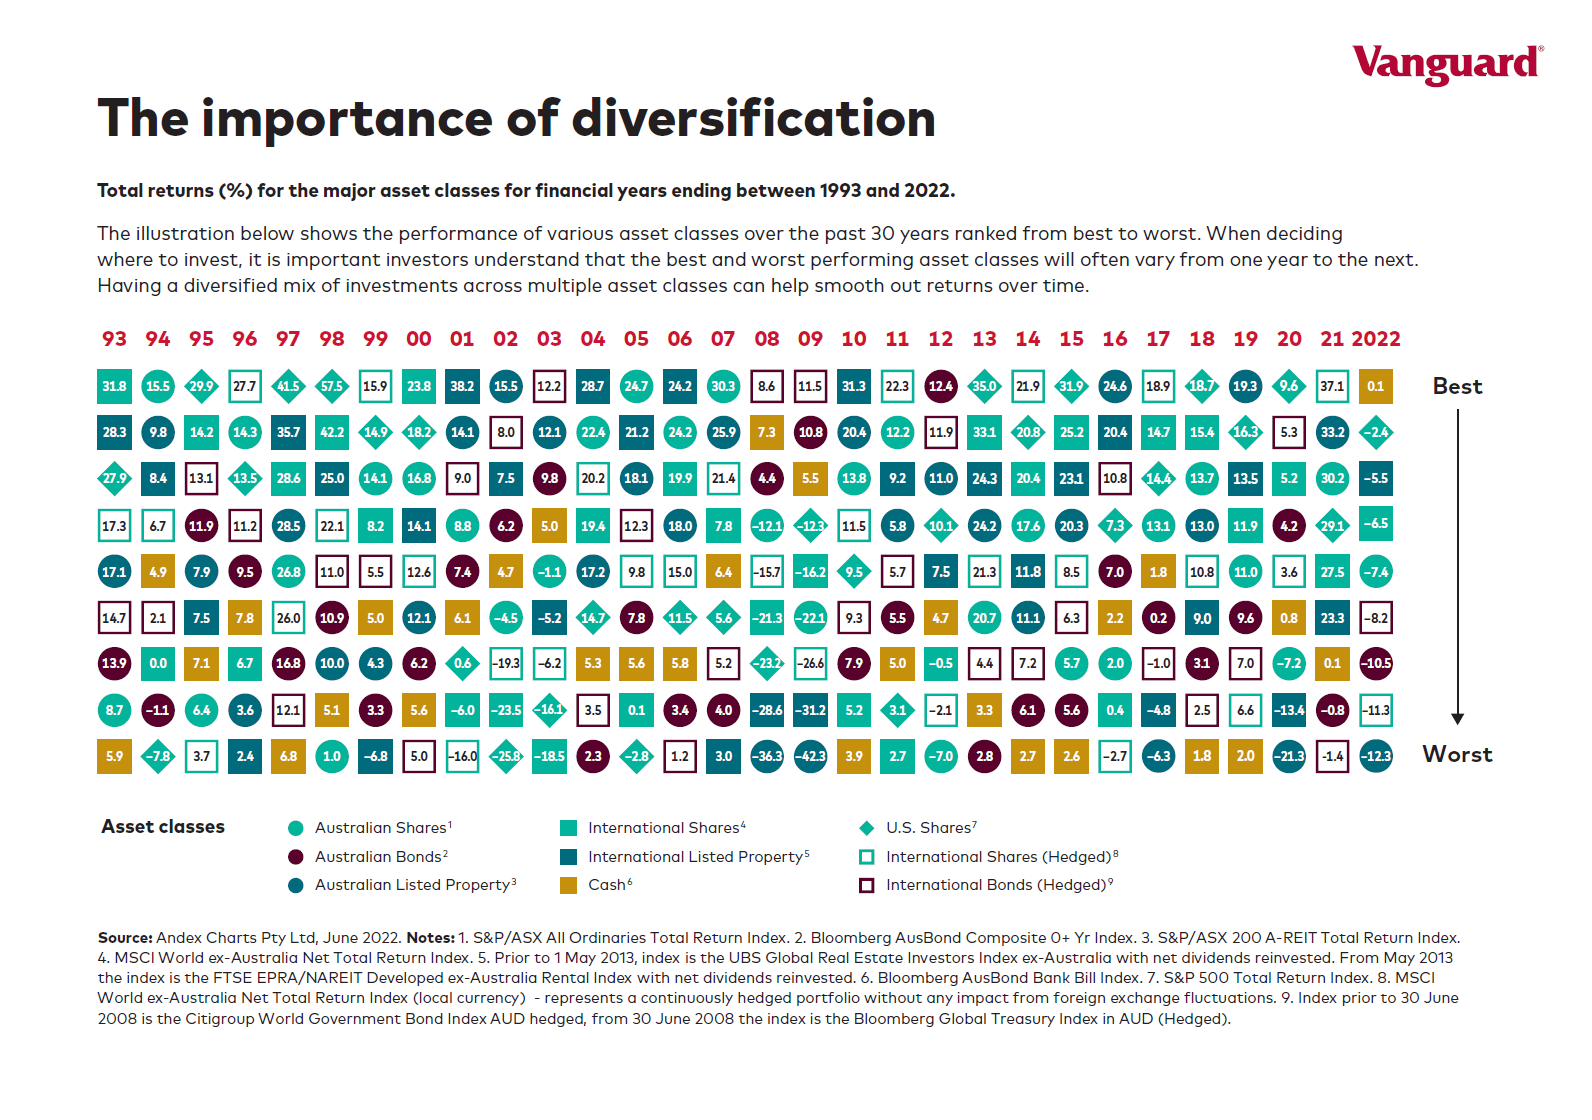
The chart below shows the total returns for major asset classes for the past 30 years from 1993 to June 2022 from an Australian market perspective. The chart again proves the importance of diversification. Only in rare occurrences, have the winning asset in one year is also the winner the following year.
Click to enlarge
Note: Returns shown are in Australian currency and 2022 data is till June, 2022
One of the best ways to build wealth with equities is to invest in growth stocks. Most growth-oriented generally do not pay any dividends as their focus is on growing. Some of the current popular growth stocks include the likes of Tesla(TSLA), Amazon(AMZN), Nvidia(NVDA), Apple(AAPL), Alphabet(GOOG), Facebook(FB), etc. However the main issue with this strategy is that it is difficult if not impossible to identity the growth superstars when they were young. Besides many of these mega growth stars were dead money for a few years while they struggled with competition or directions when they were much smaller. For example, Apple was abandoned by investors many times and left for dead years ago. Similarly Amazon was a money loser and never made any profit for years and years during and after the dot com bubble. The number of investors that held these companies thru all those years is probably very small. In addition, growth stocks can stop growing at any time or can even go bankrupt.
So the next best strategy to generate excellent returns over the long-term is to invest in dividend-paying stocks and reinvesting the dividends. Even better is to go with dividend growers. Companies that consistently grow their dividend payouts year after year are ideal to build wealth due to the effect of compounding.
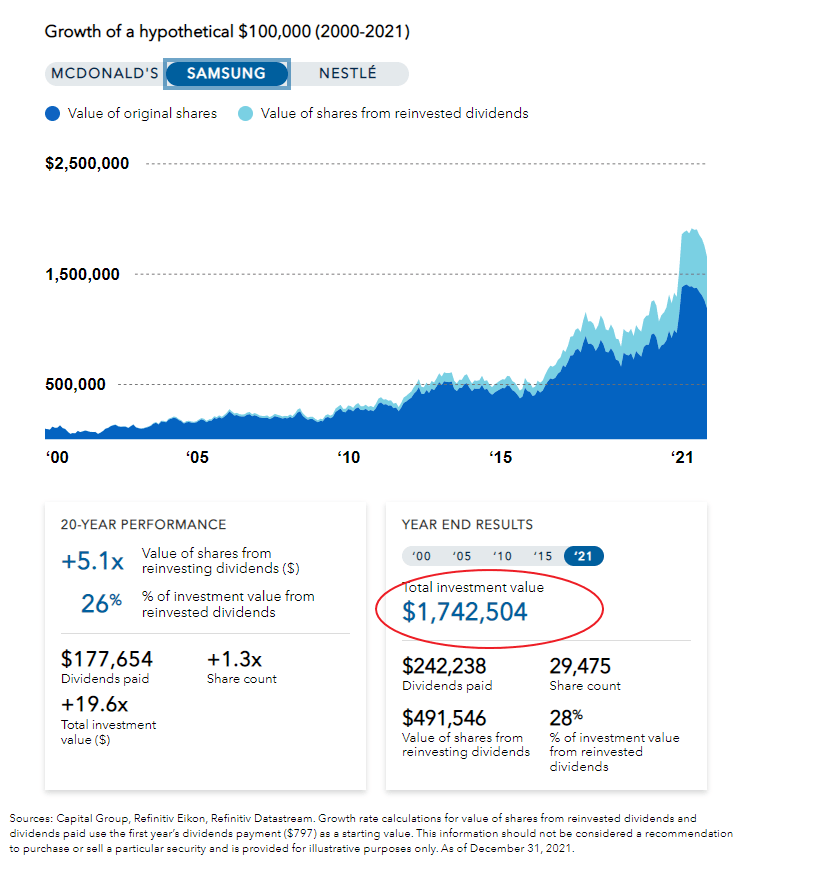
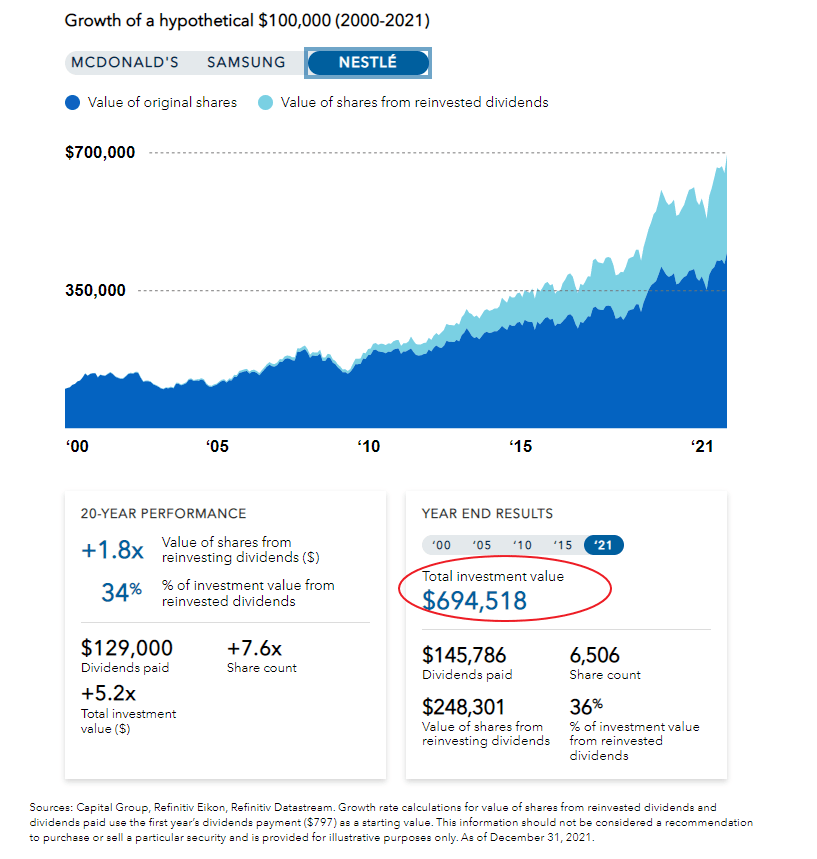
I came across an excellent article that showed the power of dividend growers using three world-class companies as examples. From the article by Caroline Randall at Capital Group:
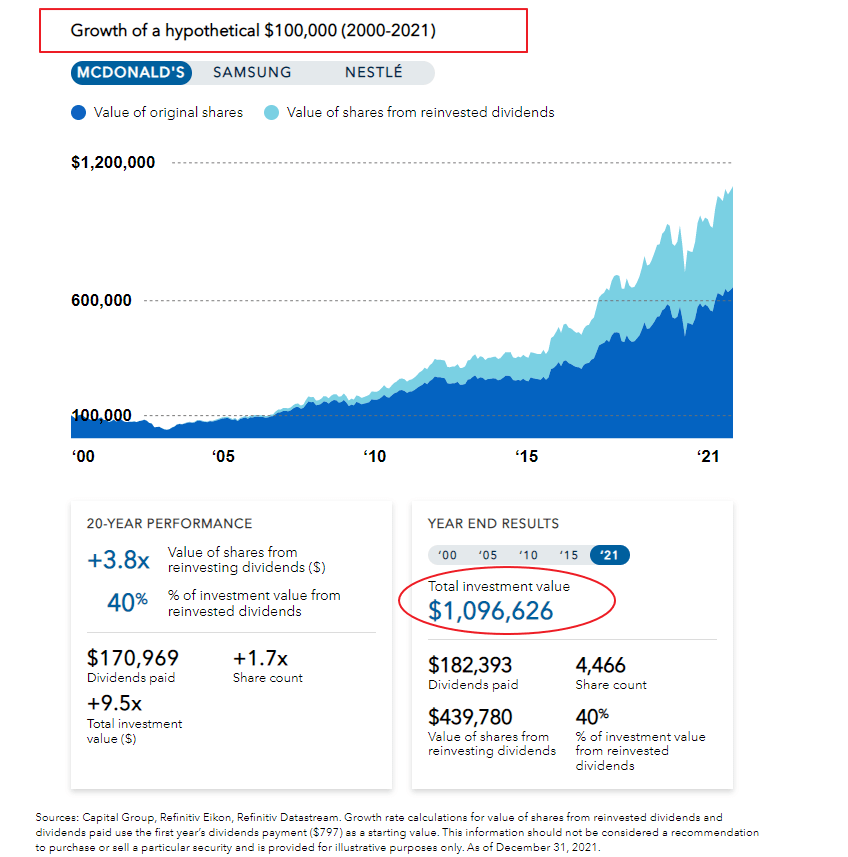
Our interactive chartshows the returns for hypothetical $100,000 investments in three historically consistent dividend growers — McDonald’s, Nestlé and Samsung — for the 20 years ended December 31, 2021. Toggle by company and year-end results to see how those initial investments would have fared over the two decades, with all dividends reinvested.
The original investment of $100K in McDonald’s (MCD) would have grown to nearly $1.1 Million in 20 years and 40% of that growth came from just reinvested dividends. This is fascinating indeed.
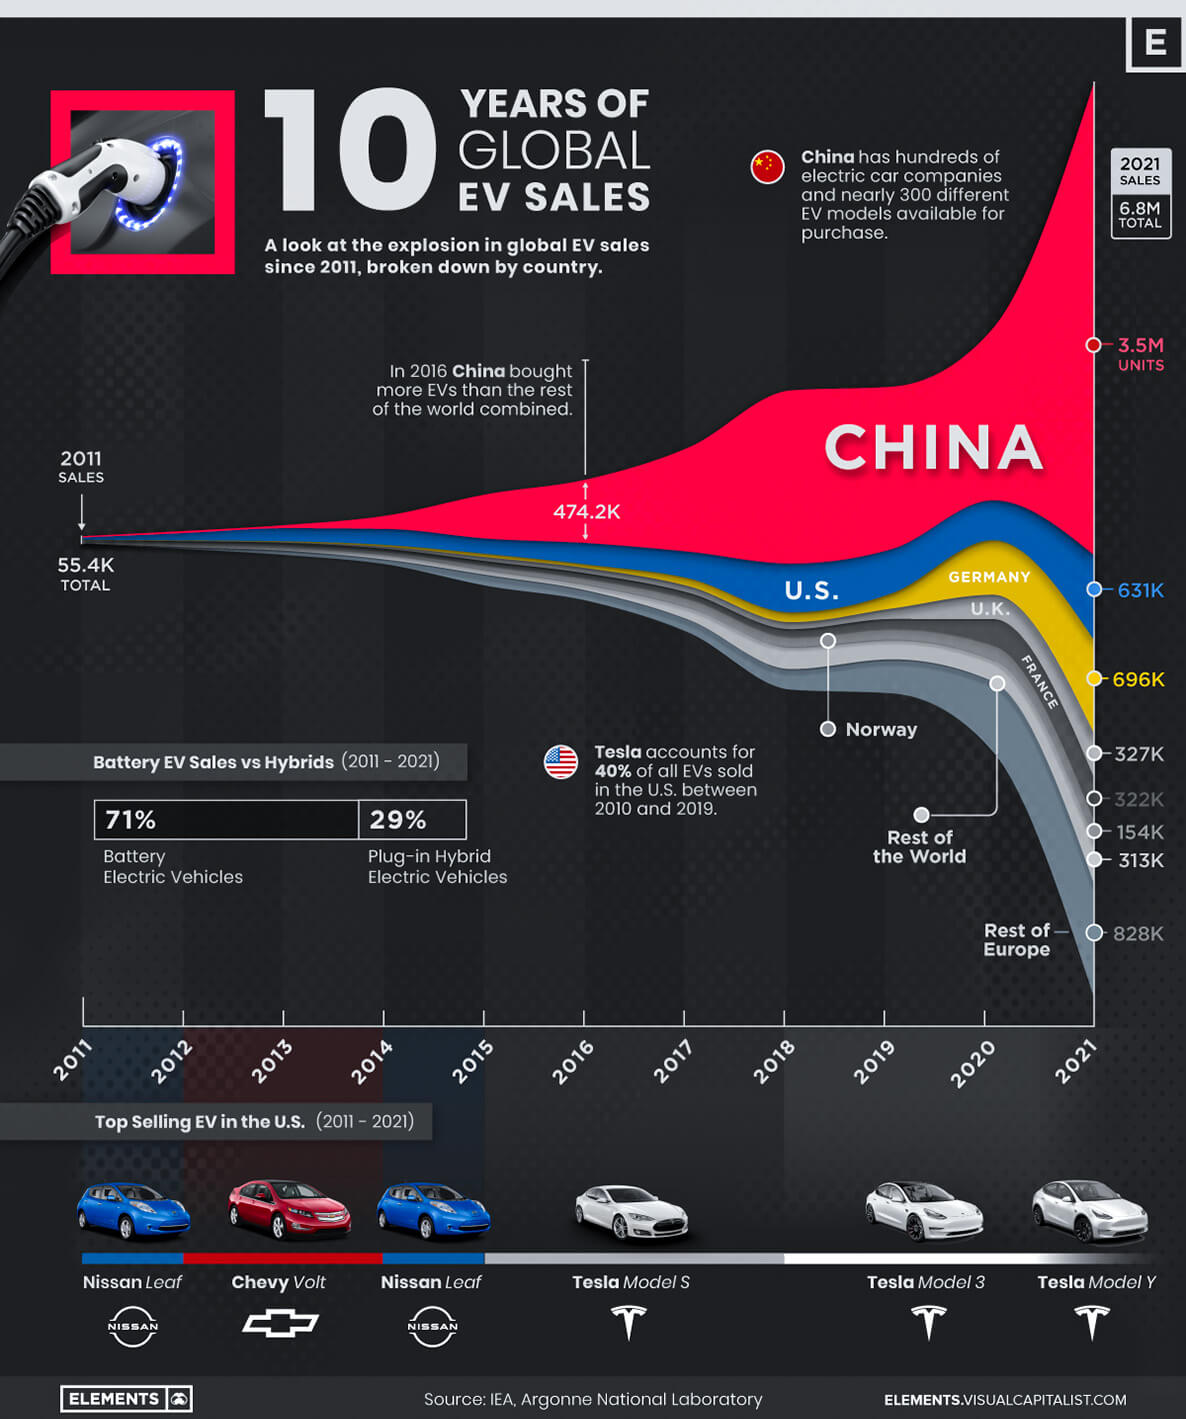
I came across the below interesting infographic on EV sales by country in the past decade. China has hundreds of companies making hundreds of EV models. EV sales has also soared there in recent years. US and Europe are yet to catch up with China. Despite incentives and high gas prices, the US is behind Europe in EV adoption.
The US equity market has dramatically recovered from the depths of the bear market reached in June this year. As of yesterday, the S&P 500 is down just over 10%. Despite the amazing run in recent weeks, not many investors are convinced that the bear is dead for a variety of reasons. Irrational exuberance by investors on some weak reading of inflation figures for last month is the main driving force behind the run up. The following are just a handful of factors that are indicative of a bear market than a bull market:
Though oil prices are falling they are still high.
Inflation is still high in many areas especially in groceries.
The Russia-Ukraine war is still on. The war that was to be the trigger for WW III is not over almost overnight with Russia defeated.
The proverbial throwing of the towel and avoid stocks like the plague has not happened yet. Investors are still excited with market movements and past manias such as the one with meme stocks is still on.
Pandemic excesses have not dissipated in many sectors of the market.
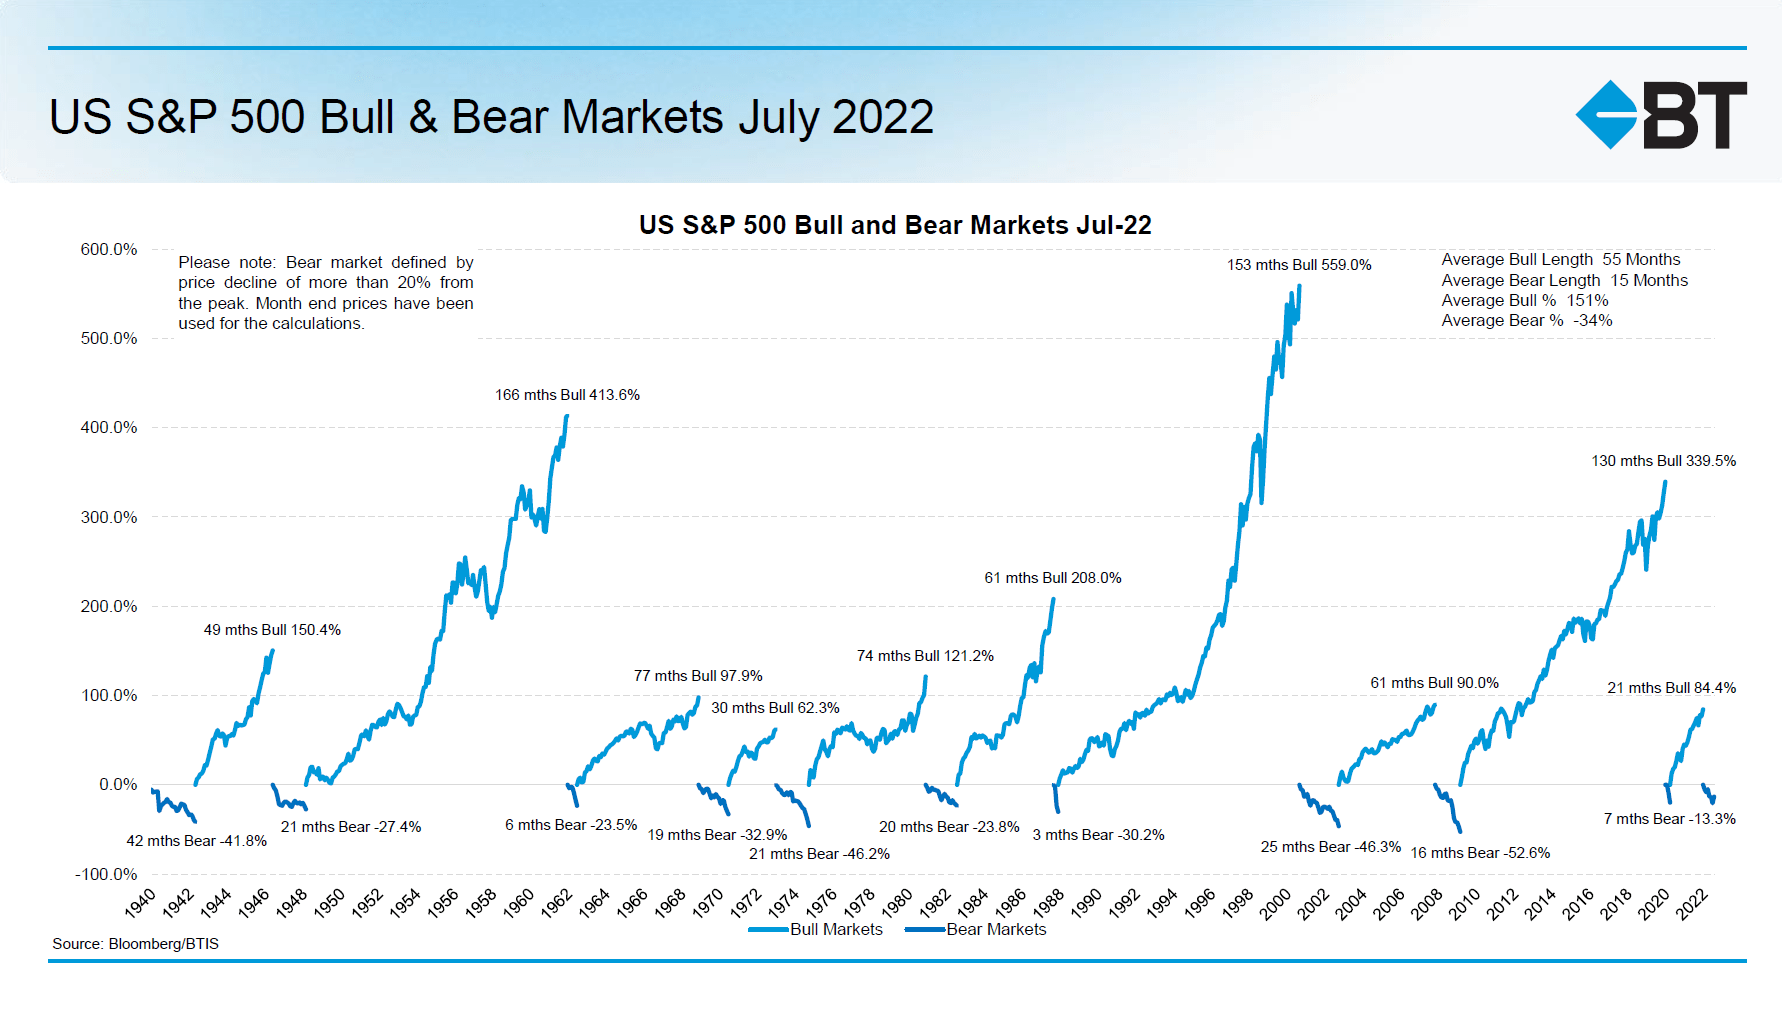
With that brief over the below chart from BT shows the bull and bear markets in the S&P 500 from 1940 thru June, 2022: