The Triad of the World Monetary System

I came across an interesting article titled “Century of China” is at hand by Berlin Irishev in The Asset magazine of Hong Kong.

From the article:

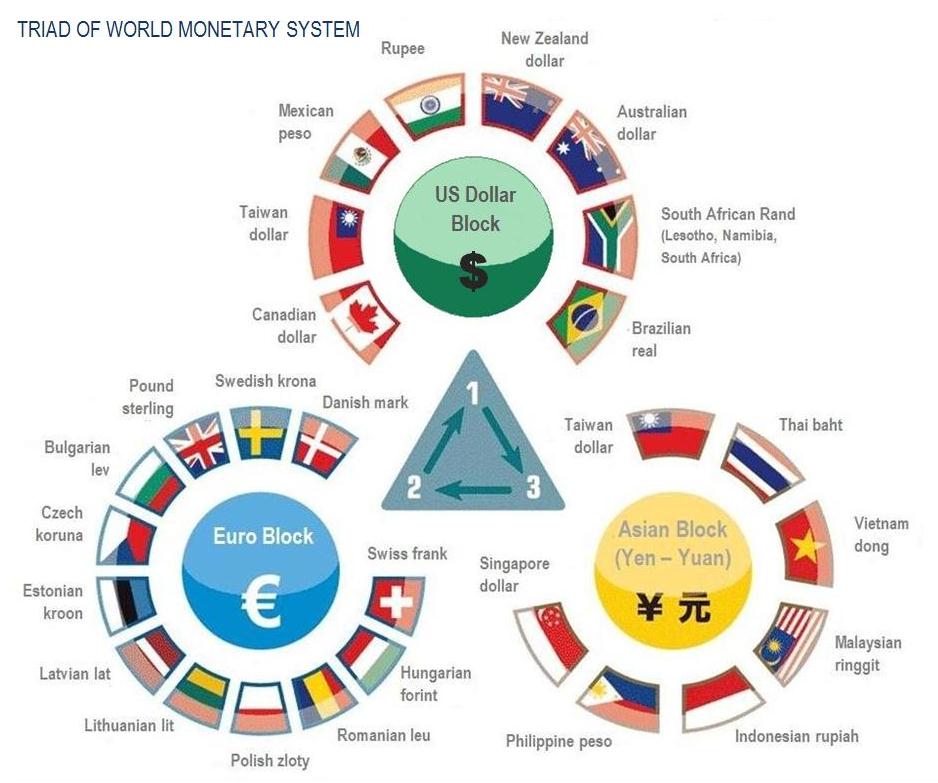
If two vertices of the triangle are represented by the USD and the euro, the third one is Asian, represented by the Chinese yuan/renminbi and the Japanese yen. The value of the monetary triad is that it expresses the real balance of economic powers represented by national or supranational (euro) currencies. It shows evolution since the top vertex can periodically change. The ambiguousness of this triad is that one of its vertices is represented by the Asian camp, where the Chinese currency – the yuan/renminbi – is dominant today. As far back as 2009, it did not have any characteristics of an international currency: it was inconvertible and was not part of the SDR (special drawing rights) – the International Monetary Fund’s basket of currencies, as the Chinese monetary data was deemed not transparent enough and the yuan/renminbi was not considered by the international community. The Chinese economy was not granted market economy status then, and the policy of China’s central bank was questioned by the West. Such resistance from countries with the world’s leading currencies caused a situation of strain, leading to what is dubbed the “international currency war”, at the beginning of 2011.

The Triad of the World Monetary System
Click to enlarge
Source: The Asset
Irishev added:

The main argument in favour of the Chinese currency is that the pace of China’s economic growth is above that of other economies. Within the next 10 years, the Chinese GDP will surpass the US, and China will inevitably become the world’s leading economic power. Even today, China holds currency reserves of over USD3.2 trillion, which allows the country to pursue an expansionist policy on a global basis. There is no country in the world that could equal China in investment volume, approaching USD400 billion from USD371 billion in 2010. We could very well be approaching “the century of China.”
It remains to be seen if the Chinese yuan will gain the stature of the Euro and the US Dollar and if the 21st century will be “century of China”.

Healthcare Costs Continue To Outpace Overall Inflation

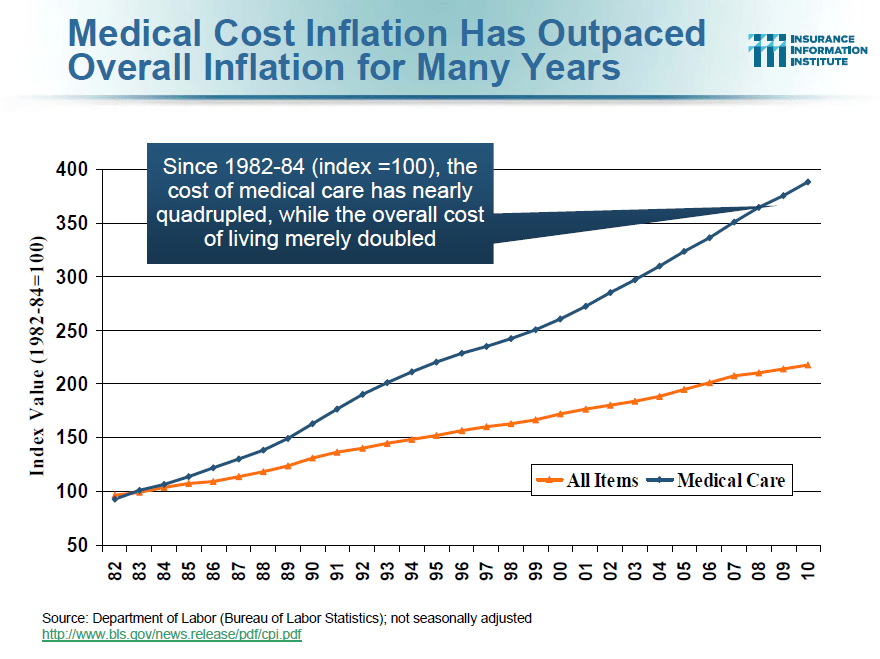
The healthcare system in the US is a mess when compared with most developed countries. Some may question whether the healthcare system is even a “system” since the system is made of a hodgepodge of actors such as thousands of healthcare companies, regulators, medical providers, billing firms, pharmaceutical firms and many others. As a result of this chaotic setup inefficiency, cost over-runs, huge amounts of unwanted paper-work, billing errors, legal issues, unnecessary procedures performed on patients, etc. are the norm. Hence healthcare is one of the very industries which defies the laws of capitalism as prices continue to skyrocket and competition is non-existent.Consumers of healthcare aka patients are also a vast disadvantage as the prices many items such as various medical procedures, consultations, lab tests, etc. are not known before so that they make informed decisions. The various actors in the industry have a strong incentive to maintain the status quo as opposed to making any meaningful improvements to the system. Hence healthcare costs continue to soar and outpace overall inflation for many years now with no end in sight as shown in the chart below:

Click to enlarge

Via: A presentation titled Health Care Reform: Implications for the Property/Casualty Insurance Industry by Steven N. Weisbart, Ph.D., CLU, Senior Vice President & Chief Economist. Insurance Information Institute, Trenton, NJ

Update:

Workers’ Health Premiums Rose 63% in 7 Years

Three Reasons Why the U.S. is Better Than China

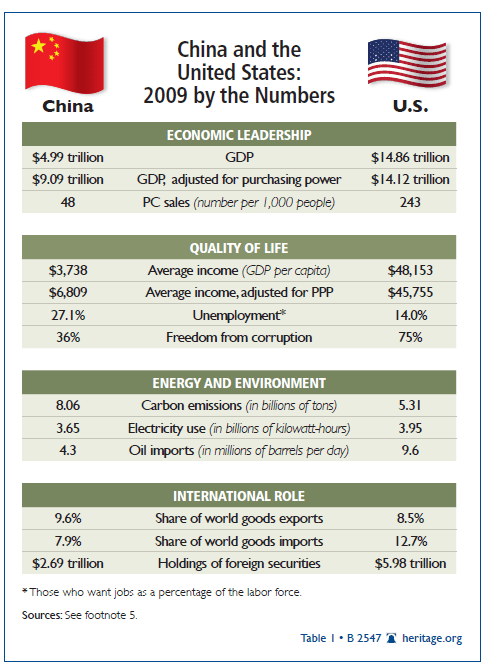
In the second quarter of 2010, the Chinese economy surpassed that of Japan making it the second biggest economy in the world. In the past few years a general belief has developed that China is on its way to become an economic superpower. However the popular notion that China is getting better than the U.S. in terms of economic growth and overall development of the society is incorrect according to a research report by Derek Scissors of The Heritage Foundation.

An economic comparison of China and US:

Click to enlarge

Source: The United States vs. China— Which Economy Is Bigger, Which Is Better by Derek Scissors, Ph.D, The Heritage Foundation

The following are three key reasons offered by Mr.Derek supporting his view that the U.S. economy is better than China’s:

1.Low Income Levels
Despite strong economic growth in the past three decades China is still a poor country and the gap between US and China in terms of wealth and income is still huge. The U.S. GDP in 2009 was nearly $15.0 trillion compared to China’s $5.0 trillion. On an average, an American had $48,000 in 2009 income while the average Chinese had less than $4,000.

2.Resource Depletion
Unlike the U.S. China is not a resource-rich country. Hence China is the world’s largest importer of many commodities. For example, China is the world’s second-largest oil importer, the biggest coal importer, the biggest soybean importer, and accounts for two-thirds of global iron ore trade by itself. The same kind of results hold true for many metals, and corn could be next.More than one fourth of China’s land is desert and hence not available for agriculture. Similar water scarcity is also an issue in some regions.

3.High Unemployment
The current official US unemployment rate is 9.0% but the unofficial figure as measured by U6 is much higher. China says that its urban unemployment figure is below 4.5 percent. But no one including the employees at the Ministry of HR do not believe this figure. The Chinese Academy of Social Sciences put the rate at 9.4% before the credit crisis. The rural unemployment has long exceeded 20 percent. Hence the US unemployment rate is relatively better than China’s. When  other factors such as trade, innovation, freedom from corruption, etc. are considered the US is in a much better position than China. This situation will continue at least for the foreseeable future.

In summary, I agree with Derek Scissors’s views on the Chinese economy. However while the U.S. economy has significant advantages over other economies, that edge is slowly eroding. Hence structural changes in the economy and policies encouraging innovation and investment in science and technology are critical to maintain the leadership position.

Comparing the 5-Year Performance of Six Large-Cap Oil Stocks

Crude oil prices have been volatile over the past few years. On Friday, the price rose $1.21 to reach $98.99 in New York. As fears of recession in the EU and the U.S. have decreased, the prices have jumped from $77.0 a barrel in early October to about $100 now.

Some investors hold the stocks of integrated oil majors in their long-term portfolios. So I wanted to check their performance in the past five years.

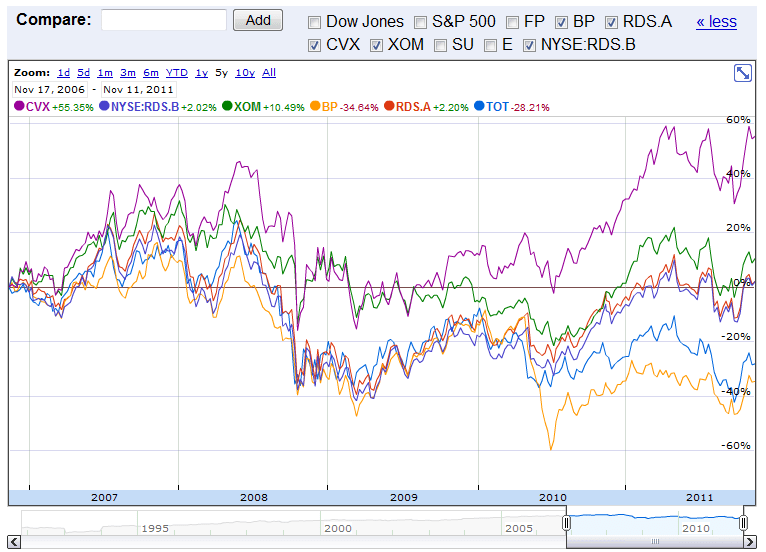
The following chart shows the 5-year equity returns based on just price appreciation of six major global oil companies:
Click to enlarge

Source: Google Finance

The table below shows the current dividends yield, market capitalization and the 5-year returns with dividends reinvested:

[TABLE=1050]

The table data shows that dividend reinvestment has boosted the returns.While British oil giant BP Plc (BP) and French major Total SA (TOT) yielded negative returns, US-based Chevron (CVX) was the best performer with a total return of about 82%. Chevron has performed much better than the widely held Exxon Mobil, the largest integrated oil company in the world. In addition, Chevron’s stock grew by about 145% over a 10-year period excluding dividends and Exxon Mobil (XOM) only doubled in price. In summary, most of the oil majors have performed well in the past few years and they must be an integral part of a well-diversified portfolio.

Note: Data noted above are known to be accurate based on sources used. Please use your own due diligence before making any investment decisions.

Disclosure: No Positions

Ten Italian Stocks Offer Potential Investment Opportunities

The Italian equity market is one of the hardest hit markets in the world this year due to the European debt crisis and Italy’s own fiscal crisis that came to the forefront of investors’ attention this week. The FTSE MIB, Itlay’s benchmark equity index is down well over 20% YTD. However with the current Prime Minister Silvio Berlusconi finally stepping down and a new government led by Mario Monti taking shape, the current crisis will be contained and the economy may grow again. With the third-largest economy in EU and the eighth largest in the world, many Italian companies offer long-term investment opportunities.

Ten Italian stocks trading on the US markets are listed below for review:

1.Company: Eni SpA (E)
Current Dividend Yield: 6.63%
Sector: Oil & Gas – Integrated

2.Company: Enel SpA (ENLAY)
Current Dividend Yield: 6.12%
Sector: Utility

3.Company:Telecom Italia SpA (TI)
Current Dividend Yield: 7.33%
Sector: Telecom

4.Company: Snam Rete Gas SpA (SNMRY)
Current Dividend Yield: 7.54%
Sector: utility

5.Company: Autogrill SpA (ATGSY)
Current Dividend Yield: N/A
Sector: Food &Drug Retailer

6.Company: Saipem SpA (SAPMY)
Current Dividend Yield: 2.05%
Sector: Oil Well Services & Equipment

7.Company:Saras Raffinerie Sarde Spa (SAAFY)
Current Dividend Yield: N/A
Sector: Oil Well Services & Equipment

8.Company: Atlantia SpA (ATASY)
Current Dividend Yield: 7.29%
Sector: Highway operator

9.Company:Luxottica Group SpA (LUX)
Current Dividend Yield: 2.19%
Sector: Medical Equipment & Supplies

10.Company: Benetton Group SpA (BNGPY)
Current Dividend Yield: 6.73%
Sector: Apparel/Accessories

Disclosure: No Positions