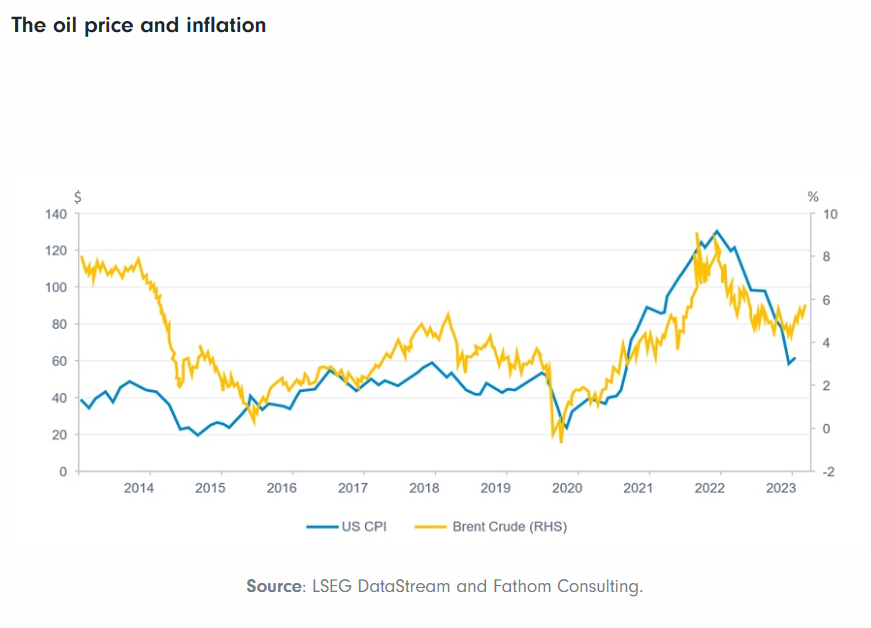
Crude oil prices have been volatile over the past few years. On Friday, the price rose $1.21 to reach $98.99 in New York. As fears of recession in the EU and the U.S. have decreased, the prices have jumped from $77.0 a barrel in early October to about $100 now.
Some investors hold the stocks of integrated oil majors in their long-term portfolios. So I wanted to check their performance in the past five years.
The following chart shows the 5-year equity returns based on just price appreciation of six major global oil companies:
Click to enlarge

Source: Google Finance
The table below shows the current dividends yield, market capitalization and the 5-year returns with dividends reinvested:
[TABLE=1050]
The table data shows that dividend reinvestment has boosted the returns.While British oil giant BP Plc (BP) and French major Total SA (TOT) yielded negative returns, US-based Chevron (CVX) was the best performer with a total return of about 82%. Chevron has performed much better than the widely held Exxon Mobil, the largest integrated oil company in the world. In addition, Chevron’s stock grew by about 145% over a 10-year period excluding dividends and Exxon Mobil (XOM) only doubled in price. In summary, most of the oil majors have performed well in the past few years and they must be an integral part of a well-diversified portfolio.
Note: Data noted above are known to be accurate based on sources used. Please use your own due diligence before making any investment decisions.
Disclosure: No Positions