Impact of Foreign Direct Investment on Equity Markets of BRIC Countries

Emerging market equities did not perform well last year compared to years before. For example, the the benchmark indices of BRIC countries were down by double digits in 2011 with India’s Sensex being the worst performer losing 24.5%. Russia’s RTS, Brazil’s Bovespa and the Shanghai Composite Index were off 22.0%, 18.1% and 21.7% respectively.

One of the factors that affect the stock market performance of these countries is foreign direct investment(FDI). While theoretically higher FDI should lead to increased economic growth, which in turn can lead to higher stock prices. However this does not happen in the real world. Stocks in emerging markets rise and fall based on many factors including the flow of foreign portfolio capital which can change direction almost overnight.

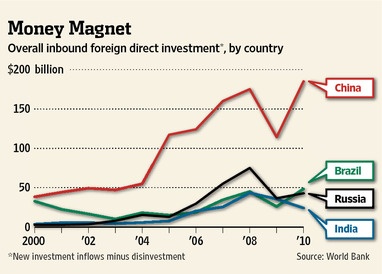
The following chart shows the comparison of FDI among BRICs since 2000:

Source: China Shifts Foreign-Investment Focus, The Wall Street Journal

Due to its large manufacturing base China is the largest recipient of FDI for many years now with India being the recipient of the lowest FDI.

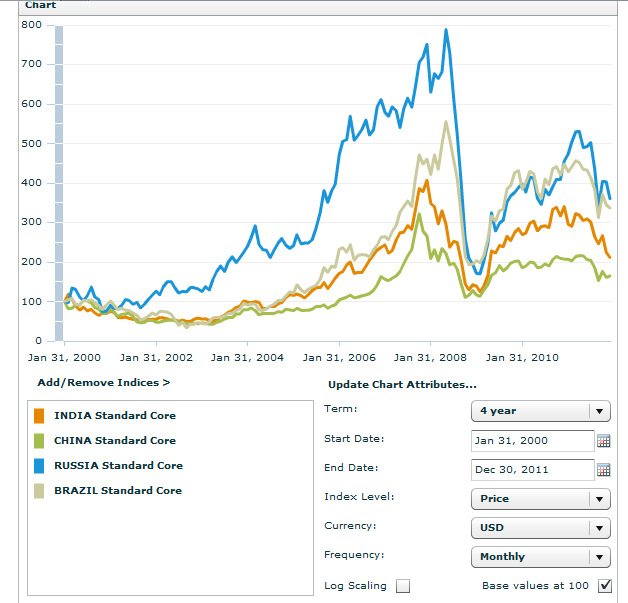
However despite receiving the highest foreign direct investment, Chinese equities have not yielded the highest return to investors as shown in the graph below:

Click to enlarge

Source: MSCI

In the period shown, the Russian equity market has outperformed the equity markets of the other three countries followed by Brazil based on the MSCI index. China was the worst performer with returns that were even lower than that of India’s. So the takeaway from this post is that higher FDI does not necessarily mean higher equity returns.

Related ETFs:

iShares MSCI Brazil Index (EWZ)
Market Vectors Russia ETF (RSX)
iShares FTSE/Xinhua China 25 Index Fund (FXI)
iShares S&P India Nifty 50 (INDY)

Disclosure: No Positions
Comparison of Obesity Rates Among OECD Countries

Healthcare costs continue to rise in OECD countries. In the United States especially it has increased for many years outpacing inflation. According to the OECD, the US per capita health spending in 2009 was $7,960 which is two and half times that of the OECD average.

One of the reasons for the high cost of healthcare in the U.S. is a higher percentage of the US population is obese compared to other countries. Obesity is the cause of many chronic conditions and people who are over-weight or obese use extensive healthcare services and as a result healthcare costs rises for the overall population. In the Health at a Glance 2011 report, the OECD notes that 50% or more of the population is obese in more than half of the member countries.

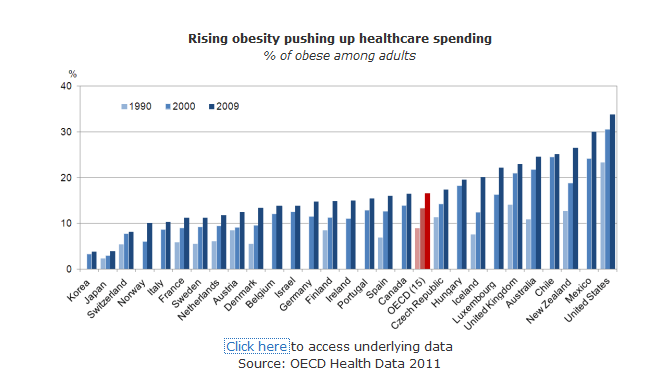
Comparison of Obesity Rates Across OECD Countries:

Source: OECD

From the report:

The obesity rate in the adult population is highest in the United States, rising from 15% in 1980 to 34% in 2008, and lowest in Japan and Korea, at 4%.

To tackle this epidemic, many OECD countries are now intensifying efforts to promote a culture of healthy eating and active living. Some have recently introduced taxes on foods high in fat or sugar – e.g. Denmark, Finland, France, and Hungary.  However, countries have yet to prove that these policies are sufficient, especially among the poorest in society who are most at risk of obesity. OECD work has shown that a comprehensive prevention strategy combining health promotion campaigns, government regulation and family doctor counselling would avoid hundreds of thousands of deaths from chronic diseases every year. It would cost from USD 10 to USD 30 per person, depending on the country.

Despite the majority of the population dependent on private healthcare in the U.S., public spending on health is very high due to Medicare, Medicaid and other social programs. As the U.S. tries to control healthcare costs, one area where politicians and regulators can focus on is reducing obesity rates in the country. Similar to some of the European countries, the U.S. can consider introducing higher taxes on fatty food items such as cheap fast foods, sugar, etc. As prevention is better than cure, it may not be a bad idea to introduce such taxes and then evaluate the impact in a few years.

European Banks To Face Further Pressure in 2012

Last year has been brutal for investors in European bank stocks. Compared to the plunge of 25% for US bank stocks as measured by The KBW Bank Index, the STOXX Europe 600 Banks Index was down about 33% in Euros. Many individual European bank stocks have performed much worse with none of their exchange-traded ADRs in positive territory for the year.

The following five worst performing European bank ADRs were:

1.Bank:Bank of Ireland (IRE)
2011 Price Change: -84.0%
Country: Ireland

2.Bank:National Bank of Greece (NBG)
2011 Price Change: -84.0%
Country:Greece

3.Bank:Lloyds Banking Group (LYG)
2011 Price Change: -76.0%
Country: UK

4.Bank:Royal Bank of Scotland (RBS)
2011 Price Change: -62%
Country: UK

5.Bank:Credit Suisse (CS)
2011 Price Change: -42.0%
Country:Switzerland

According to a “2010 Investment Outlook” report by Absolute Return Partners LLP of UK, European banks could be the main story this year. Some of the key points noted by them are:

  • European banks must raise Tier 1 Capital Ratios to 9% by the end of June 2012.
  • The European Banking Authority(EBA) estimates a total of €106 billion of new capital will be required.
  • With most bank stocks selling well below book value and with earnings under pressure, few are keen to raise new equity capital.
  • The alternative is to delever with Morgan Stanley estimating that between €1.5-2.5 Trillion of deleveraging to occur over the next 18 months (or 3-5% of total assets).
  • Barclays Capital puts the figure as high as 10%.
  • With political pressure to continue domestic lending,banks may cut back on non-domestic lending.
  • Since banks have to shrink assets by as much as 10% to meet the 9% Tier 1 Capital Ratio target, they may pull out of Central and Eastern Europe where non-performing loans are high.

Source: Absolute Return Partners LLP

In addition to issues facing the banking sector, recently some economic experts have suggested that recession has already returned to Europe.  Hence from an investment standpoint investors may want to completely avoid European bank stocks in 2012.

Disclosure: Long LYG

Review: Components of the STOXX Europe Maximum Dividend 40 Index

STOXX, the leading European index provider, launched a new index called “The STOXX Europe Maximum Dividend 40 Index“. Derived from the STOXX Europe 600 index, this index is a blue-chip index comprising the 40 highest dividend-yielding companies across Europe and represents companies with the highest expected dividend yield in the upcoming quarter.

The key features of the index include:

The index portfolio is reviewed quarterly in order to track as closely as possible the performance of the highest dividend-yielding companies and to take into account the fact that in Europe dividend payments take place frequently throughout the year.
The index portfolio is screened for liquidity based on two modes:

Index constituents must have a 3-months average daily trading value (ADTV) of at least EUR 4 million.
Stocks are selected on the basis of their liquidity-adjusted dividend yield
In order to generate a well diversified index portfolio, the weights of the components are capped at 10%.
The weighting of the single components is based on their expected liquidity-adjusted dividend yield: the higher the dividend yield of a company and the higher its liquidity, the higher its weight in the index.

The 40 components of The STOXX Europe Maximum Dividend 40 Index are listed below with their ADR tickers if available and the current dividend yields:

[TABLE=1052]

Disclosure: Long BBVA, SAN, BTLCY