The S&P 500 in a bear market with a loss of 25% YTD. Canada’s TSX Composite is down relatively lesser with a decline of 13% year-to-date. On a sector basis, how much have Canadian banks fallen?
Click to enlarge
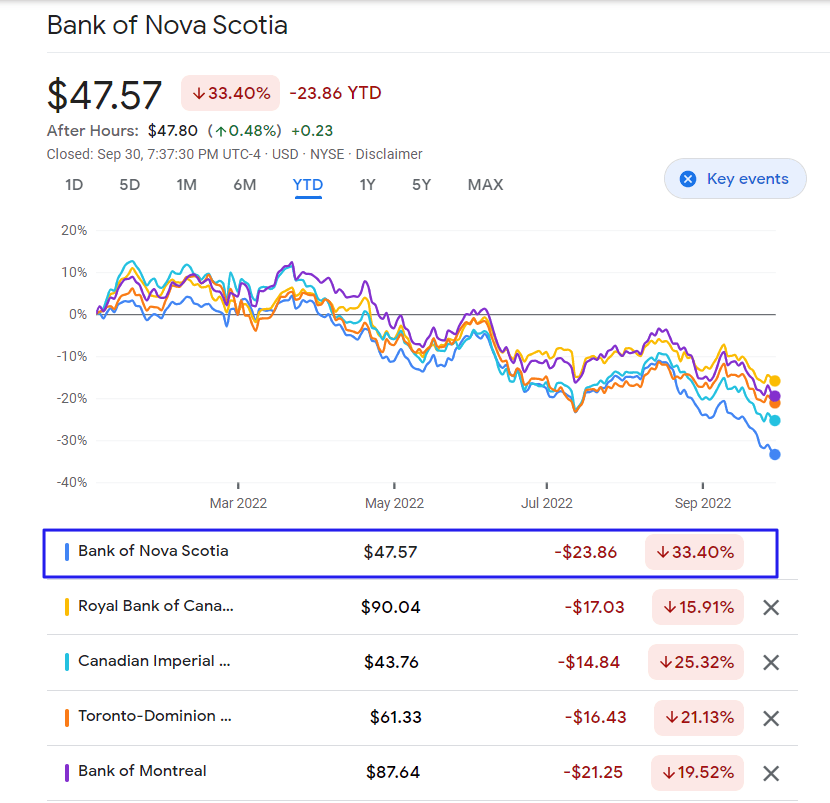
Source: Google Finance
RBC (RY) is down by about 16%. The worst performer so far this year is ScotiaBank(BNS). High exposure to emerging markets in Latin America and other factors have led to a loss of 33%.
Long-term investors will find dividend yields of these banks attractive at current levels. However with the overall market still facing further declines and recession on the horizon it is wise to keep an eye on these stocks and nibble a little during big decline days.
Disclosure: Long BNS, BMO, CM, RY and TD