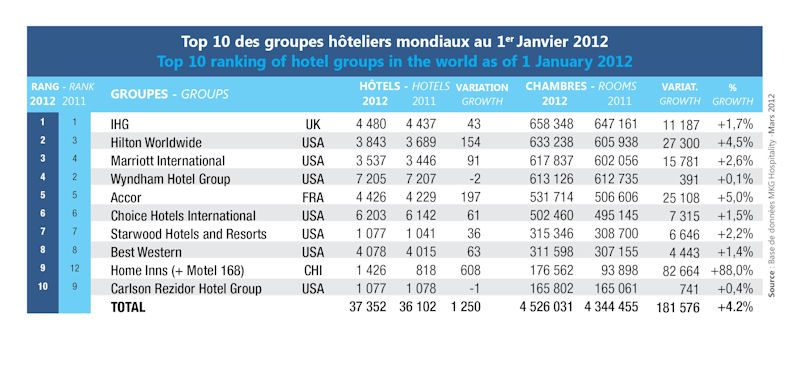
The Top 10 Hotel Groups in the World for 2012 is shown below:
Click to enlarge

Source: Hotel Online
Of the top 10, four groups have more than 600,00o rooms each. UK-based Intercontinental Hotels Group plc (IHG) tops the ranking with about 660,000 rooms. Seven of the ten hotel groups are US-based.
In this year’s ranking, the Chinese group Home Inns doubled its capacity due to the takeover of its national competitor Motel 168 and pushed out Hyatt Hotels (H) from the Top 10.
From a recent Cornell University study on the US hotel industry stocks:
Hotel industry stocks are far more sensitive than the rest of the equity market to changes in interest rates, according to a new study from the Cornell Center for Hospitality Research (CHR). When the U.S. Federal Reserve unexpectedly changes the federal funds rate, the entire stock market reacts, but changes in hotel stock prices are much more dramatic than the market as a whole. The study, “Saving the Bed from the Fed,” by Levon Goukasian and Qingzhong Ma, is available at no charge from the CHR. Goukasian is the John and Francis Duggan Professor of Business at Pepperdine University, and Ma is an assistant professor of finance in the Cornell School of Hotel Administration.
“Hotel stocks are sometimes viewed as risky,” observed Ma. “Our study shows that it’s true that hotel stocks react strongly to unexpected changes in the fed funds rate. However, investors may find hotels to be a valuable part of their portfolio, particularly if they apply appropriate risk management strategies.” Goukasian and Ma also found that restaurant stocks do not react as strongly to unexpected changes in the fed funds rate.
The Top 10 Global Hotel Groups are listed below with their tickers and current dividend yields:
1.Company: IHG InterContinental Hotels Group (IHG)
Current Dividend Yield: 2.17%
Country: UK
2.Company: Hilton Hotel Corp.
Current Dividend Yield: N/A
Country: USA
3.Company: Marriot International (MAR)
Current Dividend Yield: 1.38%
Country: USA
4.Company: Wyndham Hotel Group (WYN)
Current Dividend Yield: 1.75%
Country: USA
5.Company: Accor SA (ACRFY)
Current Dividend Yield: 2.44%
Country:France
6.Company: Choice Hotel International, Inc. (CHH)
Current Dividend Yield: 1.80%
Country: USA
7.Company: Starwood Hotel & Resorts Worlwide (HOT)
Current Dividend Yield: 0.90%
Country: USA
8.Company: Best Western International
Current Dividend Yield: N/A
Country: USA
9.Company: Home Inns & Hotels Management Inc (HMIN)
Current Dividend Yield: N/A
Country: China
10.Company: Carlson Rezidor Hotel Group
Current Dividend Yield:
Country: USA
Disclosure: No Positions


