During the great recession between 2006 and 2009 the unemployment rate in advanced countries increased more than in emerging countries. However the change in unemployment between developed countries rates has varied significantly. Some countries such as Australia and Japan fared better while countries like Spain, Ireland, etc. experienced a strong growth in the unemployment rates.
In the U.S. the official unemployment rate as of July stood at 8.3% with some 12.8 million persons out of work. The latest unemployment rates in select advanced economies are shown below:
US = 8.3%
Germany = 6.8%
Canada = 7.3%
Australia = 5.2%
UK = 8.1%
Japan = 4.3%
France = 10.0%
Spain = 24.6%
According to the IMF, the unemployment rate in advanced countries is projected to fall by less than 0.5% by 2014 due to the week economic recovery.
According to the article “Tracking the Global Recovery” by Ayhan Jose, Prakash Loungani and Marco E.Torrones in the latest version of IMF’s Finance and Development magazine,
Three factors account for this variation: the extent of growth (or lack thereof) in incomes, structural bottlenecks, and the impact of macroeconomic and labor market policies.Structural factors may have played a supporting role in some countries, particularly where the collapse of the housing sector was a major reason for the drop in output. And the role of policies, particularly labor market policies such as worksharing,could be important in some specific cases, such as in explaining why Germany had a decline in unemployment.
In Germany, employers receive subsidies to encourage them to retain workers but reduce their working hours and wages.
Among the three factors, the authors note that the growth factor is the most important.
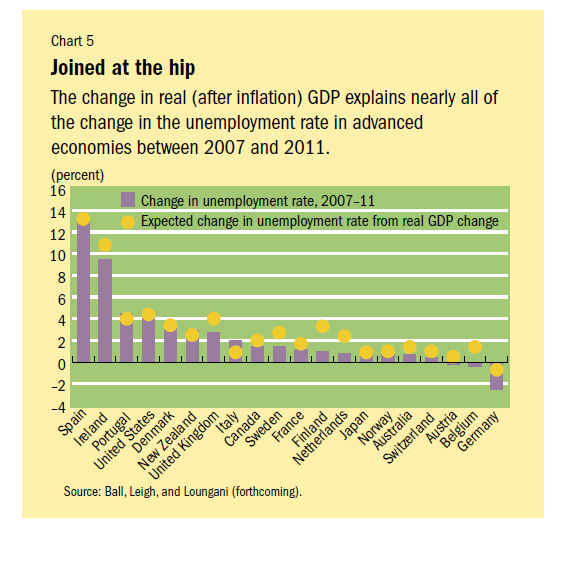
The following chart shows the change in the unemployment rate for select advanced economies between 2007 and 2011:
Click to enlarge

Source: Finance and Development, June 2012, IMF
Spain, Ireland, Portugal and the U.S. experienced the largest increase in unemployment rates for the period between 2007 and 2011. However in Australia, Switzerland, Austria, Belgium, and Germany, the unemployment rate barely rose or even decreased over those years. The reason for the difference in unemployment rates between these two sets of countries can be attributed to Okun’s law which explains the relationship between increases in unemployment and decreases in a country’s GDP. It states that for every 1% in unemployment rate, a country’s GDP will decrease by about 2% from its potential GDP.


