The US economy is headed towards a recession next year according to an article in the journal today. Economic contractions lead to job losses, firms earning lower profits, consumers cutting spending and other adverse affects. One of the key questions on investors’ mind is how long the recession will last. Since equities have already declined significantly this year further declines is inevitable. With that said, below is an excerpt from the journal article:
The U.S. will enter a recession in the coming 12 months as the Federal Reserve battles to bring down persistently high inflation, the economy contracts and employers cut jobs in response, according to The Wall Street Journal’s latest survey of economists.
On average, economists put the probability of a recession in the next 12 months at 63%, up from 49% in July’s survey. It is the first time the survey pegged the probability above 50% since July 2020, in the wake of the last short but sharp recession.
Their forecasts for 2023 are increasingly gloomy. Economists now expect gross domestic product to contract in the first two quarters of the year, a downgrade from the last quarterly survey, whereby they penciled in mild growth.
On average, the economists now predict GDP will contract at a 0.2% annual rate in the first quarter of 2023 and shrink 0.1% in the second quarter. In July’s survey, they expected a 0.8% growth rate in the first quarter and 1% growth in the second.
Employers are expected to respond to lower growth and weaker profits by cutting jobs in the second and third quarters. Economists believe that nonfarm payrolls will decline by 34,000 a month on average in the second quarter and 38,000 in the third quarter. According to the last survey, they expected employers to add about 65,000 jobs a month in those two quarters.
Forecasters have ratcheted up their expectations for a recession because they increasingly doubt the Fed can keep raising rates to cool inflation without inducing higher unemployment and an economic downturn. Some 58.9% of economists said they think the Fed will raise interest rates too much and cause unnecessary economic weakness, up from 45.6% in July.
Source: Economists Now Expect a Recession, Job Losses by Next Year, WSJ
If this projection comes true and if a recession starts next year, how long will it last. According to a research report from Capital Group, the average recession lasted 10 months based on the study all business cycles since 1950. From the report:
The good news is that recessions generally haven’t lasted very long. Our analysis of 11 cycles since 1950 shows that recessions have persisted between two and 18 months, with the average spanning about 10 months. For those directly affected by job loss or business closures, that can feel like an eternity. But investors with a long-term investment horizon would be better served looking at the full picture.
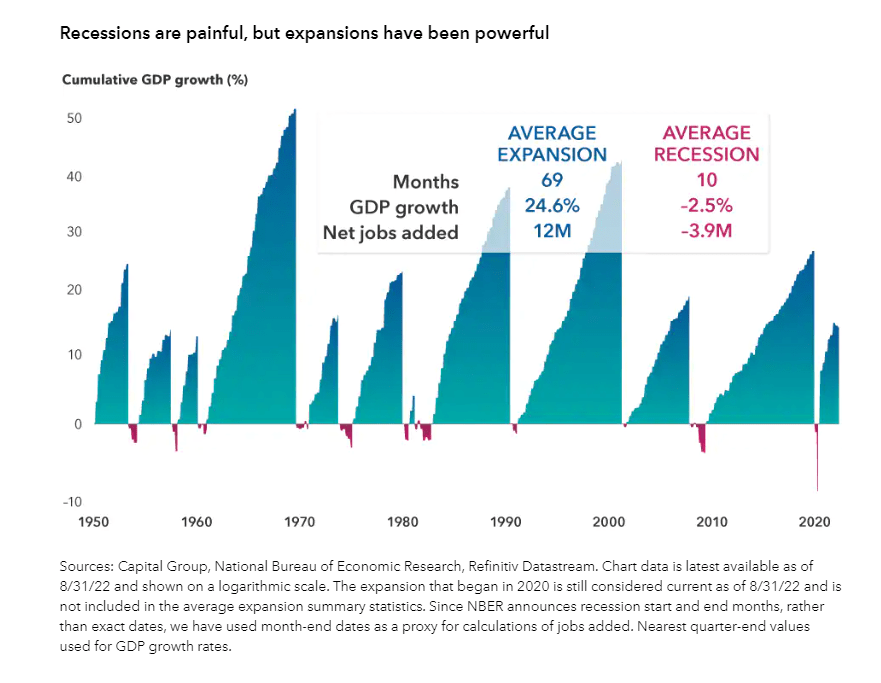
Recessions have been relatively small blips in economic history. Over the last 70 years, the U.S. has been in an official recession less than 15% of all months. Moreover, their net economic impact has been relatively small. The average expansion increased economic output by almost 25%, whereas the average recession reduced GDP by 2.5%. Equity returns can even be positive over the full length of a contraction since some of the strongest stock rallies have occurred during the late stages of a recession.
Source: Guide to recessions: 9 key things you need to know, Capital Group
As per the WSJ piece, the average postwar recession lasted 10.2 months.
So it is going to be a bumpy ride for equity investors from now thru most of next year.