The Top 10 ADRs on the NYSE Based on Market Capitalization

The top 10 foreign companies listed on the New York Stock Exchange based on market capitalization are listed below:

[table “117” not found /]


Among the foreign banks,  HSBC Holdings plc  (HBC) has the largest market cap. Colombia’s Ecopetrol (EC) has had an exponential growth since listing and its market cap is closer to that of established industry giants BP and Royal Dutch Shell.

Disclosure: No Positions
A Review of the US ETF Industry

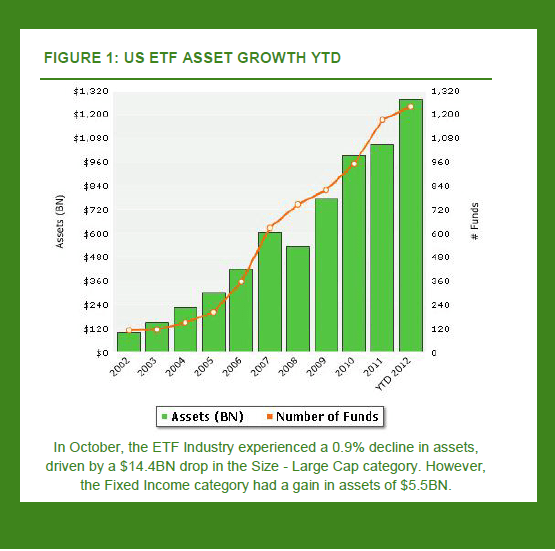
The growth of the ETF industry in the U.S. in recent years has been phenomenal. ETF providers have sliced and diced equities, fixed income instruments and other assets into every way possible. Yet still new ETFs continue to launched on a regular basis.

As of October this year, a total of 1,240 Exchange-Traded Funds (ETFs) were managed by 37 ETF providers.The total assets in these funds equaled a whopping $1.3 Trillion.

Click to enlarge


Some of the interesting facts about the ETF industry include:

  • The inverse/leveraged category of funds has the highest number of ETFs at 179 followed by fixed income with 175 funds.
  • For investing in foreign equities, there are 122 ETFs for developed markets, 128 for emerging markets and 48 under the international specialty category.
  • The top three ETF providers are Blackrock (iShares), State Street Global Advisors (SPDR) and Vanguard. These three firms dominate the market accounting for 83% of the US listed ETF market.

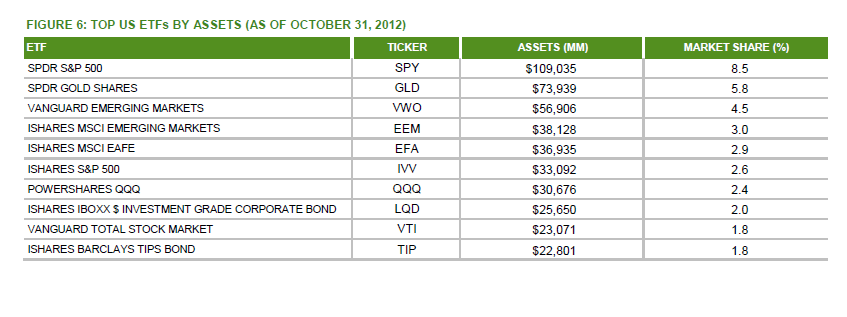
The top 10 ETFs by asset size as of October, 2012 are shown below:


The presence of two emerging market funds (VWO and EEM) among the top five shows investors’  interest in emerging markets.

Source: ETF SNAPSHOT: October 2012, SPDR

Disclosure: No Positions

US Sector Periodic Table of Returns 2001 To 2011

The Periodic Table of Investment Returns for the nine S&P sectors is shown in the chart below:

Click to enlarge


Source: SPDR

Here are a few observations:

  • At the height of the global financial crisis in 2008, financials fell over 55% while consumer staples fell only about 15%. Utilities fell by 23% and healthcare also fell lower than financials.
  • No one sector ranked as the best performing sector any consecutive year except energy in 2004. This shows the need for diversification.
  • Except in 2001, 2002 and in 2008, the energy sector yielded strong returns underscoring the importance of oil and other related sectors in the U.S.

Related ETFs:

SPDR Consumer Discretionary Select Sector SPDR Fund (XLY)
SPDR Consumer Staples Select Sector SPDR Fund (XLP)
SPDR Energy Select Sector SPDR Fund (XLE)
SPDR Financials Select Sector SPDR Fund (XLF)
SPDR Health Care Select Sector SPDR Fund (XLV)
SPDR Industrials Select Sector SPDR Fund (XLI)
SPDR Technology Select Sector SPDR Fund (XLK)
SPDR Materials Select Sector SPDR Fund (XLB)
SPDR Utilities Select Sector SPDR Fund (XLU)

Disclosure: No Positions

Dividend Tax Rate and Long-Term Capital Gains Tax Rate: U.S vs.Other Countries

The long-term capital gains tax rate is currently at 15%. This rate was implemented as part of the tax cuts package during the Bush administration and is set to expire on Dec 31, 2012. The long-term capital gains rate is applied on gains realized from stocks held for over one year  60 days.

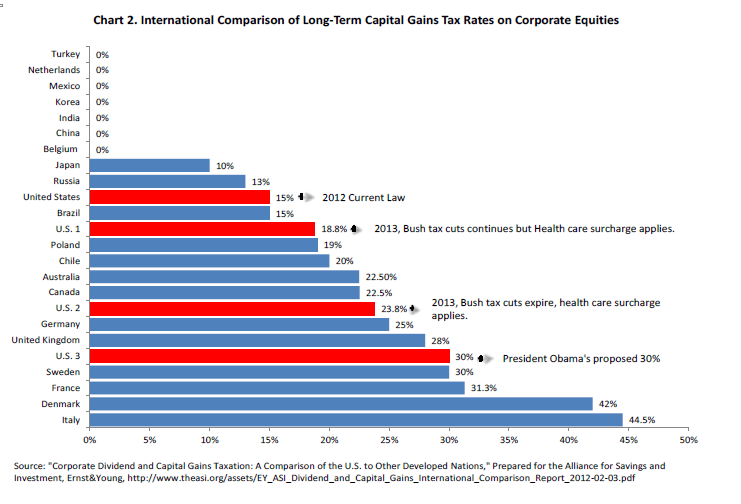
Though the 15% rate seems low, it is unfavorable  when compared with that of other major countries according to a testimony by Pınar Çebi Wilber, Ph.D., Economist of the American Council for Capital Formation to the Joint Hearing House Committee on Ways and Means and Senate Committee on Finance. Changes to the long-term capital gains tax rate can potentially take three different ways as indicated by U.S. 1, U.S. 2 and U.S. 3 in the chart below:

Click to enlarge


Source: The Impact of Raising Tax Rates on Individual Capital Gains by Pınar Çebi Wilber, Ph.D.Economist, American Council for Capital Formation

  • In the scenario 1, the Bush tax cut rate will continue at 15% but an investment surtax of 3.8% will be added for all boosting the rate to 18.8%.
  • In the second scenario, the Bush tax cuts expire and the capital gains tax rate will jump to 20%. This is the same rate that was in effect during  President Bill Clinton. With the addition of 3.8% surcharge for Obamacare, the final tax rate will be 23.8%. During his election campaign, Mr.Obama proposed to increase the long-term capital gains tax rate to 20% for high income earners. This group represents people earning $200,000 or $250,000 for married couples.
  • The third scenario is the worst case possible. Under this scenario, Mr.Obama proposed to raise the capital gains tax rate to 30% for many taxpayers using the “Buffett rule”. This rule would apply to people making more than $1 million.

Dr. Wilber testified that the 30% tax rate would make the U.S.the fifth highest after Italy, Denmark, France and Sweden. Higher capital gains tax rate would adversely affect the competitiveness of the U.S. and make the country less attractive to foreign investors.

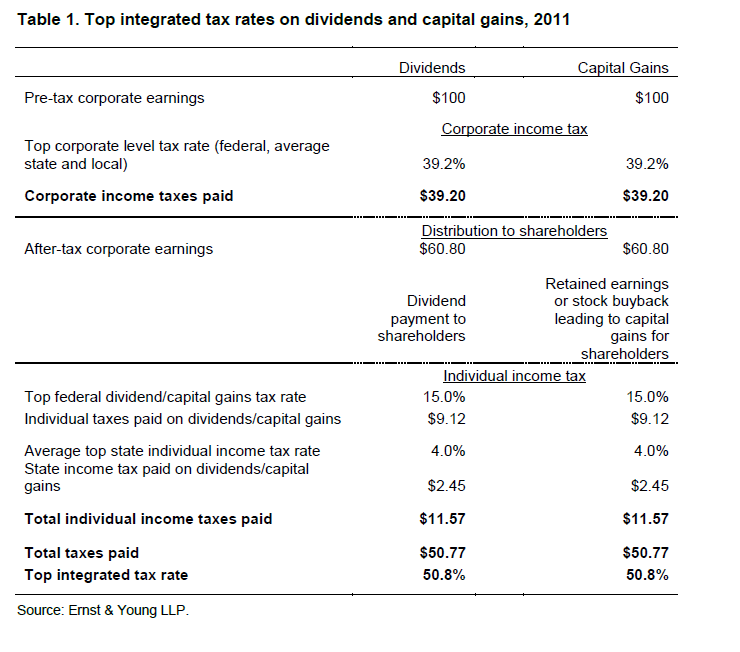
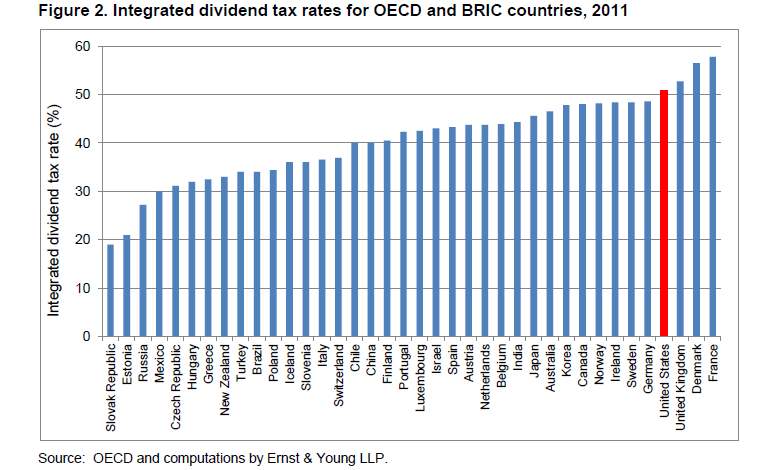
The top dividend tax rate on qualified dividends is now at 15.0%. This rate is also much higher when it is bench-marked against the rate of other countries according to a research study by Ernst & Young. Instead of using the qualified dividend tax rate they have used a rate called the “integrated dividend tax rate”. The calculations for this new rate of tax measurement is shown in the table below:


The U.S. integrated dividend tax rate at 50.0% ranks the country at number four with only France, Denmark and UK having higher rates.

Click to enlarge

Source: Corporate Dividend and Capital Gains Taxation: A comparison of the United States to other developed nations, Drs. Robert Carroll and Gerald Prante, Ernst & Young LLP, February 2012

Why its time to look at European Utility Stocks

The STOXX® Europe 600 Utilities Index can be considered as a proxy for the European utility sector. The index is comprised of 25 utilities from the continent. As of November 25, 2012 the index is down over 58% in the past five years in US $ terms. Since 2008, the index has been on a downtrend trend as shown in the chart below. The sector may be ready for a rebound from the current lows as extreme pessimism haunts European stocks.

Click to enlarge


Source: STOXX

How to invest in European Utilities?

Unfortunately there is no European utility sector-specific  ETF available on the US markets for investing in European utilities. ETFs tracking the STOXX utilities index and trading on the European markets include the STOXX® EUROPE 600 UTILITIES ETF by db X-Trackers, iShares STOXX Europe 600 Utilities, SPDR MSCI Europe Utilities ETF and Lyxor ETF STOXX Europe 600 Utilities fund.

Many of these utility stocks are off by double digit percentages due to regulatory issues such as plans to end nuclear power generation by Germany, high uncertainty towards the sector due to the ongoing fiscal crisis in some Eurozone countries, reduction of dividend payments by some companies and investors’ general apathy towards all European stocks. While all these factors are understandable, many of the worries are way overblown. Despite the fall in share prices the sector continues to pay juicy dividends and has the potential to raise dividends when the crisis ends. Another way to look at the current situation is that most of the negative views are already reflected in the current stock prices.

The table below lists the components of The STOXX® Europe 600 Utilities Index with the ADR tickers if available and the current dividend yields:

S.No.CompanyTickerDividend Yield as of Nov 26, 2012Country
1CENTRICACPYYY4.77%UK
2DRAX GRPDRXGYN/AUK
3E.ONEONGY7.25%Germany
4EDFECIFY7.81%France
5EDP ENERGIAS DE PORTUGALEDPFY9.38%Portugal
6ENAGASENGGY6.48%Spain
7ENDESAN/AN/ASpain
8ENELENLAY8.92%Italy
9ENEL GREEN POWERN/AN/AItaly
10FORTUMFOJCY7.27%Finland
11GAS NATURAL SDGGASNY7.12%Spain
12GDF SUEZGDFZY13.35%France
13IBERDROLAIBDRY0.72%Spain
14NATIONAL GRIDNGG5.56%UK
15PENNON GRPN/AN/AUK
16RED ELECTRICA CORPORATIONRDEIY9.83%Spain
17RWERWEOY6.30%Germany
18SCOTTISH & SOUTHERN ENERGYN/AN/AUK
19SEVERN TRENTN/AN/AUK
20SNAM RETE GASSNMRY9.84%Italy
21SUEZ ENVIRONNEMENTSZEVY7.67%France
22TERNATEZNY6.98%Italy
23UNITED UTILITIES GRPUUGRY4.63%UK
24VEOLIA ENVIRONNEMENTVE8.44%France
25VERBUNDOEZVY3.39%Austria

Note: Dividend yields noted are as of Nov 26, 2012.

Investors looking to add European utilities and willing to hold for at least five years can add some of these stocks at current or lower levels in a phased manner.

Disclosure: Long EONGY, VE, RWEOY, FOJCY