“The time to buy is when there’s blood in the streets.” – Baron Rothschild
I came across a Bloomberg BusinessWeek article from June, 2012 discussing about finding hidden opportunities in Greece. Since the Greek equity market was decimated during the previous few years as a result of the Greek crisis and the ensuing recession, George Elliott of hedge fund Naftilia Asset Management seemed to believe that investing in Greek stocks was a wonderful investment opportunity. In fact, he raised $63 million from investors for his Greek Opportunity Fund which planned to invest in nothing but Greek stocks.
One of the best times to invest in stocks is at the depth of a crisis when investors’ fear is at the highest peak. The following chart shows the performance of three benchmark indices from the lowest point attained during a crisis:
Click to enlarge
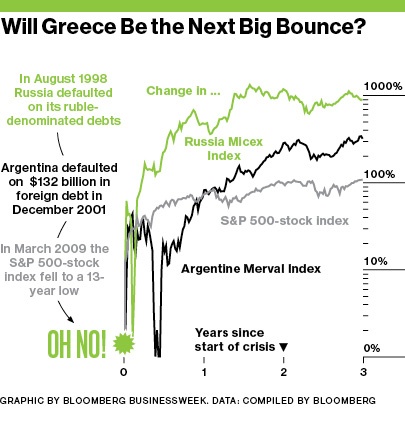
Source: A Hedge Fund Hunts for Greece’s Hidden Gems, Bloomberg BusinessWeek, June 21, 2012
The returns for the indices shown above are indeed great. For example, the S&P 500 more than doubled from the March 2009 lows.
The strategy suggested by George Elliot is an excellent idea. However for most retail investors it does not mean that one should jump into equities with both feet during a crisis. Many stocks that plunged during the crisis are still down by more than 50% or more and may never recover to pre-crisis levels in one’s lifetime. But adding even small amounts of stocks or funds at the depth of crisis can enhance a portfolio’s overall return substantially.
For example, U.S. bank stocks suffered badly as a result of the recent global financial crisis. While most have recovered strongly since then many are nowhere where they were before the crisis hit. Here is chart showing the 5-year performance of KBW Bank index which is a benchmark index for regional banks:
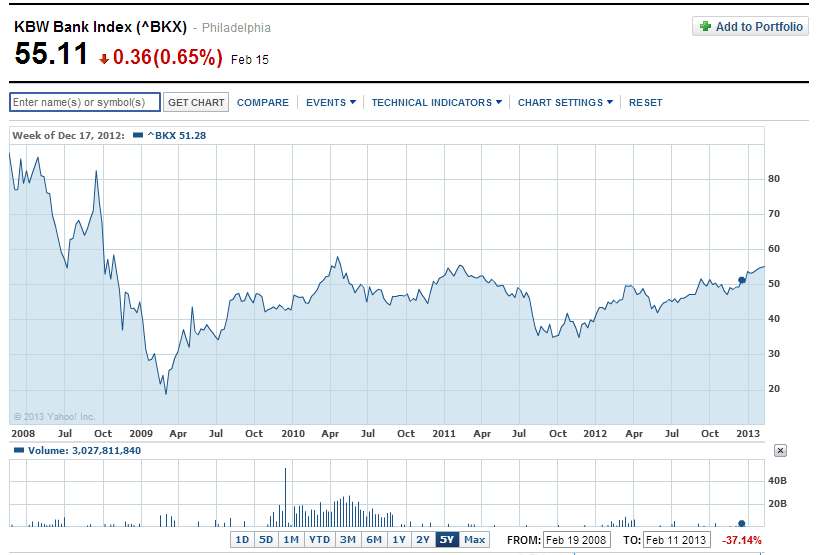
Source: Yahoo Finance
Another factor to consider is that investing during a crisis may not be the best idea for all countries. This is especially true for emerging or frontier markets where political risks are huge. So the chances of an investor losing everything is high.According to a research report by Dr. Bryan Taylor, President of Global Financial Data, Inc. for decades Latin American countries yielded inferior or mediocre returns. In the case of Peru, the stock market declined by 99% in real terms between the 1940s and 1980s and finally investors were wiped out due to outright confiscation by the state. So this example shows that a crisis may last for decades and investing in crisis-ridden countries may not be the greatest strategy.
Related ETFs:
SPDR S&P Bank ETF (KBE)
SPDR S&P Regional Banking (KRE)
PowerShares KBW Regional Banking ETF (KBWR)
PowerShares KBW Bank Portfolio ETF (KBWB)
iShares Dow Jones U.S. Regional Banks Index Fund (IAT)
iShares MSCI All Peru Capped Index Fund (EPU)
Disclosure: No Positions