Why Invest In Canadian Dividend Stocks

Many Canadian companies generally tend to have higher dividend yields than their peers south of the border. For example, the dividend yield of the benchmark S&P/TSX Composite Index was 3.3% at the end of February relative to just 2.5% for the S&P 500 according to FT market data. Since Canada is mostly a natural resources-based economy, Canadian equity markets are home to hundreds of resource firms in the mining and related sectors. Hence when looking for investment opportunities in Canada, it is wise to avoid the speculative plays such as start-up gold miners, oil exploration companies, etc. and instead focus on the well-established dividend paying stocks. The reason for this suggestion is that unlike in the U.S., dividends account for a substantial portion of the total return of Canadian stocks.

The following charts show the significance of dividend returns in the total returns of the S&P/TSX Composite Index:

Dividends-Part-in-Total-Returns-of-Canada-Benchmark-Index

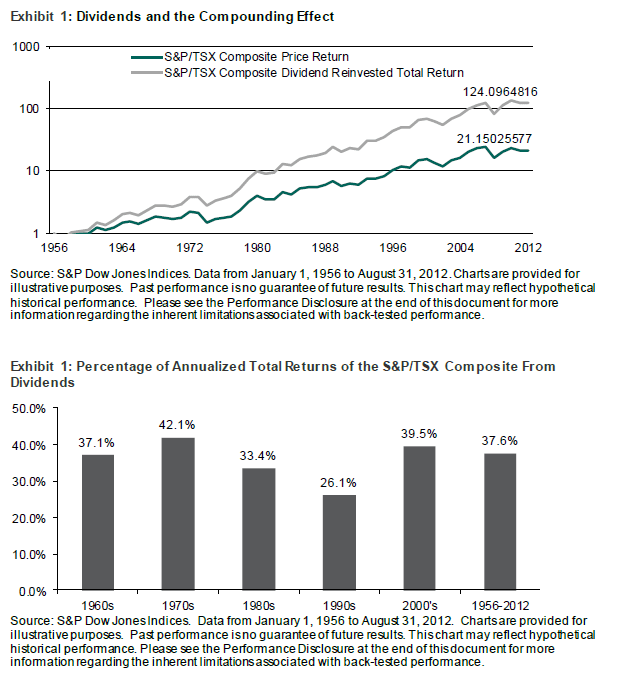
Note: Returns shown above are based on Canadian dollars.

Source: The Role of Dividends in Income Portfolios, Practice Essentials Canada, Indexing 201, S&P Dow Jones Indices

Dividends accounted for about one-third of the total returns of the S&P/TSX Composite Index with price appreciation contributing the remaining two-thirds since 1956 as per the research report by Standard & Poor’s. As the above chart shows, from 1956 to 2012 dividends have made up about an astonishing 38% of the total returns of the S&P/TSX Composite Index.

Ten Canadian stocks trading on the US markets with yields of more than 2% are listed below for consideration:

1.Company: TELUS Corp (TU)
Current Dividend Yield: 3.62%
Sector: Telecom

2.Company: BCE Inc (BCE)
Current Dividend Yield: 5.01%
Sector: Telecom

3.Company: Manulife Financial Corp (MFC)
Current Dividend Yield: 3.49%
Sector: Insurance

4.Company: TransCanada Corp (TRP)
Current Dividend Yield: 3.85%
Sector: Oil & Gas Transportation

5.Company: Enbridge Inc (ENB)
Current Dividend Yield: 2.81%
Sector: Oil & Gas Transportation

6.Company: Bank of Novo Scotia (BNS)
Current Dividend Yield: 3.84%
Sector: Banking

7.Company: Bank of Montreal (BMO)
Current Dividend Yield: 4.62%
Sector: Banking

8.Company: Canadian Imperial Bank of Commerce (CM)
Current Dividend Yield: 4.53%
Sector: Banking

9.Company: Royal Bank of Canada (RY)
Current Dividend Yield: 3.95%
Sector: Banking

10.Company: Toronto-Dominion Bank (TD)
Current Dividend Yield: 3.81%
Sector: Banking

Note: Dividend yields noted are as of Mar 1, 2013

It should be noted that Canada gives preferential treatment to stocks held in qualified US retirement accounts such as IRAs with respect to withholding taxes on dividends. Canada does not withhold the usual withholding taxes on dividends from Canadian companies if the stocks are held in these accounts. Hence in addition to high dividend yields offered by Canadian firms, this tax policy provides an added incentive for US investors to invest in Canadian dividend stocks.

Disclosure:  Long all five banks noted above.

Two Ways To Invest in Foreign Financials Without Going Abroad

One way to invest in foreign financial companies is via their American Depository Receipts if they are listed on the US markets.Recently I came the KBW Global Financials (ex-u.s.) Index created by investment bank Keefe, Bruyette & Woods. The components of the index include some of the major global financials that US investors can access easily thru ADRs.

Definition of the KBW Global Financials (ex-u.s.) Index:

The Index is currently comprised primarily of American depository receipts. The Index is a modified market capitalization weighted index that seeks to reflect the performance of approximately 60 non-U.S. financial companies that are principally engaged in the business of providing financial services and products, including banking, insurance and diversified financial services.

The components of this index at the end of February are listed below with their current dividend yields:

S.No.Index ComponentTickerDividend yield as of Mar 1, 2013
1ACE LimitedACE2.29%
2AegonAEG4.62%
3Aspen Insurance Holdings LimitedAHL1.89%
4Alterra Capital Holdings LimitedALTE2.08%
5Aviva PLCAV7.65%
6Allianz SEAZSEY4.35%
7Brookfield Asset Management IncBAM1.56%
8Banco BradescoBBD2.91%
9Banco Bilbao Vizcaya ArgentariBBVA5.64%
10CorpbancaBCA6.90%
11Banco de ChileBCH3.62%
12Barclays Capital, IncBCS2.24%
13BBVA Banco Frances SABFR0.00%
14Banco Macro SABMA0.00%
15Bank of Montreal Group of Cos.BMO4.62%
16Bank of Nova ScotiaBNS3.84%
17Banco Santander-ChileBSAC3.92%
18Banco Santander Brasil SABSBR4.75%
19BanColombia SACIB2.49%
20Canadian Imperial BankCM4.53%
21Credit Suisse GroupCS2.99%
22Deutsche Bank SecuritiesDB2.13%
23Gafisa ADSGFA0.00%
24Grupo Financiero Galicia SAGGAL0.00%
25HSBC Holdings PLCHBC3.28%
26HDFC Bank Ltd. ADSHDB0.61%
27Desarrolladora HomexHXM0.00%
28Icici BankIBN1.37%
29ING Groep NVING0.00%
30Bank of IrelandIRE0.00%
31Inversiones y Representaciones S.A. (IRSA)IRS10.35%
32US Itau Unibanco Holding SAITUB3.23%
33Orix USA CorpIX1.00%
34Kookmin BankKB1.78%
35China Life InsuranceLFC1.22%
36Lloyds TSB GroupLYG0.00%
37Manulife FinancialMFC3.49%
38Mizuho Financial GroupMFG3.33%
39Montpelier Re Holdings Ltd.MRH1.89%
40Mitsubishi UFJ Financial GroupMTU2.62%
41Nomura HoldingsNMR0.82%
42PartnerRe Ltd.PRE2.87%
43Prudential PLCPUK2.73%
44A.F.P. Provida SAPVD8.02%
45Royal Bank of Scotland GroupRBS0.00%
46Royal Bank of CanadaRY3.95%
47Shinhan FinancialSHG1.70%
48Sun Life Financial ServicesSLF5.09%
49Sumitomo Mitsui Financial GroupSMFG3.03%
50Banco SantanderSAN11.58%
51Toronto-Dominion BankTD3.81%
52UBS AGUBS0.70%
53Westpac Banking CorpWBK4.38%
54Woori Finance Holdings Co., Ltd.WF1.81%
55XL Group plcXL1.94%


Source: KBW

One cannot invest directly in the index. However the PowerShares KBW International Financial Portfolio ETF (KBWX) is based on the KBW Global Financials (ex-u.s.) Index. This ETF has a small asset base of just over $2.4 million and the 12-month yield is 5.15%. The fund was launched in late 2010 and in one year the fund is up by about 27% which is close to the  return of the KBW benchmark index.

Note: Dividend yields noted are as of Mar  1, 2013

Disclosure: Long many companies noted in the table above.

Knowledge is Power: Stock Buybacks, Canadian Banks, Frontier Markets Edition

Eurozone unemployment hits 11.9%  (BBC)

The Rich 100: Canada’s wealthiest people (Canadian Business)

In-App Buying: Don’t Let Your Kids Make Apple Rich (Bloomberg)

Exploring the next frontier: A review of frontier equity markets (Vanguard)

Does Supporting Passenger Railways Reduce Road Traffic Externalities? (Vox)

Canadian banks’ last hurrah? Payouts to shrink as economy sputters (Financial Post)

How the world wide web was won (OECD Observer)

Aberdeen: Emerging market trackers are “absurd” (FE Trustnet)

Buybacks are wrong in principle (Business Line)

Challenges for Italy’s next PM in 10 charts (part 1)

Challenges for Italy’s next PM in 10 charts (part 2) (FT Data blog)

Click to enlarge

insel01 010100_27g

Cafe Insel on Mur river, Graz, Austria

Photo Courtesy: Pixdaus

The Top Holders of Gold

Many Central Banks were the sellers of gold from 2002 to 2009 during which time gold prices rose steadily.As they sold, private investors have been the net accumulators of gold many via the ETF route. As a result, currently ETFs hold more than 2,500 metric tons of the stuff approaching the holdings of the mighty IMF. The top holders of gold are shown in the chart below:

Click to enlarge

Top-Gold-Holders

Source: Why Gold’s Lustre Will Fade (In Focus) (Feb 21 2013). CIBC World Markets

It is indeed interesting to see how much gold ETFs have become popular with the investing public.

SPDR® Gold Shares (GLD) is the largest gold ETF in the world. It was listed first on the NYSE in November 2004. According to the provider’s site:

SPDR® Gold Shares is the largest physically backed gold exchange traded fund (ETF) in the world. SPDR® Gold Shares also trade on the Singapore Stock Exchange as well as the Tokyo Stock Exchange and the Stock Exchange of Hong Kong.

As of today, the trust holds 1,53.88 tons of gold worth over an astonishing $63.0 billion.Here is the long-term return of this ETF:

GLD-ETF

Source: Yahoo Finance

Disclosure: No Positions

Are Mid-Caps Better Than Small and Large-Caps?

Mid-cap stocks have outperformed small and large-caps since 2008 and even from 1993. This is interesting since some think small caps would outperform the other two types. Mid-caps can defined as stocks from market capitalization of $1.0 billion or more.Some consider companies with market capitalizations of $3.0 billion or more as mid-caps. There is no one definition of this.

The following chart shows the performance of mid-caps against small and large-caps since 1993 thru 2012:

Click to enlarge

Mid-Small-Large-Cap-Returns-Since-1993

Source: T.Rowe Price Report, Issue No 118, Winter 2013 , T.Rowe Price

Clearly mid-cap companies are performing extremely well as shown by the wide gap between them and the other two types of stocks. So investors can consider adding some mid-cap exposure to their portfolios.

How to invest in mid-cap stocks?

Investing directly in individual companies in this space is tricky as there are hundreds of companies to choose from.Besides it is very easy to go wrong as one has to be depend purely on price growth than dividends for most of the total returns.This is because most mid-caps pay a small or no dividends. The best way to invest in these companies is via an ETF.

Some of the ETFs that focus on the mid-cap companies are listed below:

  1. S&P MidCap 400 SPDR ETF (MDY)
  2. iShares Russell Midcap Index Fund (IWR)
  3. iShares S&P MidCap 400 Index Fund (IJH)
  4. iShares Russell Midcap Growth Index Fund (IWP)
  5. Powershares Dynamic Mid Cap Growth Portfolio Fund (PWJ)
  6. Powershares Dynamic Mid Cap Portfolio Fund (PJG)
  7. Schwab U.S. Mid-Cap ETF (SCHM)
  8. SPDR Dow Jones Wilshire Mid Cap ETF (EMM)
  9. SPDR S&P 400 Mid Cap Growth ETF (MDYG)
  10. Vanguard Mid-Cap ETF (VO)
  11. Vanguard Mid-Cap Growth ETF (VOT)
  12. Vanguard S&P Mid-Cap 400 ETF (IVOO)
  13. Vanguard S&P Mid-Cap 400 Growth ETF (IVOG)

Disclosure: No Positions