The German economy is the largest in Europe with a GDP size of about 2.6 Trillion Euros in 2012. As an export-driven economy, Germany consistently runs an export surplus.
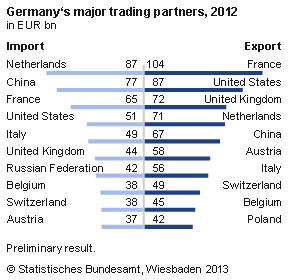
The following chart shows Germany’s major trading partners in 2012:
Click to enlarge
Source: De Statis
Some interesting facts about Germany’s trade:
- Germany’s most important trade partners are other European countries. For example, the major source of imports last year was The Netherlands and the destination for exports was France.
- About 69% of “Made in Germany” goods were exported to European countries.
- The 2nd most important market for German exports were Asia followed by the Americas.
- Asia accounted for only 18% of German imports.
- After France, the top destination for German exports was the U.S. and UK.
- In terms of imports, the country’s major import partners were The Netherlands followed by China and France.
- While the U.S. is a major export and import market for Germany, Canada does not appear in the top 10 trading partners list.
Related ETFs:
- Market Vectors Germany Small-Cap ETF (GERJ)
- iShares MSCI Germany Index Fund (EWG)
- iShares MSCI Germany Small Cap Fund (EWGS)
Disclosure: No Positions