The stock market of Philippines was one of the best performing stock markets last year. It has continued that upward trend and has shot up by another 24% so far this year according to an article in the FT beyondbrics blog.
An article on Frontier Markets in Bloomberg BusinessWeek earlier this year had an interesting take on Philippines. From the article:
Witness the Philippine stock market, which is by far the best-performing in the world since the crash of ’08, according to Bloomberg data. Compare this state of affairs with how that economy was devastated in the Asian economic crisis of 1998, when it was so broke that a pair of its national airline’s planes were seized in Los Angeles to satisfy the demands of the U.S. Export-Import Bank. Today, for all its resurgence, Manila’s entire bourse is worth as much as Microsoft (MSFT). It’s not even represented in the top 10 of the iShares or Guggenheim fund; the former is dominated by Kuwait and Qatar, the latter by Chile and Colombia, all of which are arguably more developed than frontier.
From an investment standpoint, the Philippine economy has many positive factors that makes it attractive to overseas investors. For example, the vast pool of skilled and low-cost labor with fluent English language skills are coveted by call center operators.
Most of the Philippine companies trade on the OTC market. Only one of firms is listed on the NYSE. Telcom services provider Philippine Long Distance Telephone (PHI) has a 2.75% dividend yield and currently has a market capitalization of about $16.0 billion.
The simplest way for US investors to access the Philippine market, is to invest via the iShares MSCI Philippines Investable ETF (EPHE).
1-Year performance of the iShares Philippines ETF:
Click to enlarge
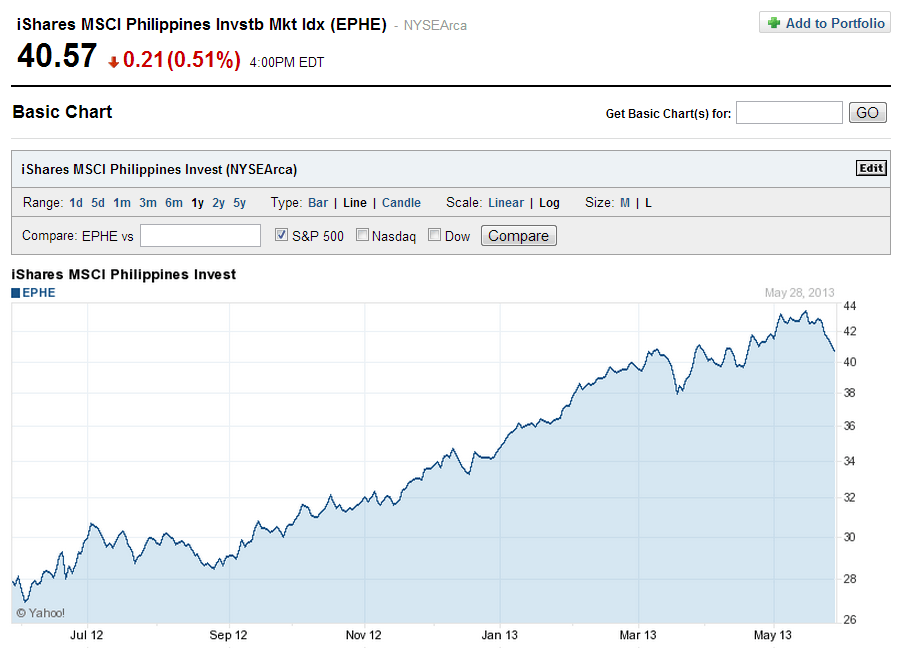
Source: Yahoo Finance
The fund’s holdings is made up of 42 firms and the asset size is over $487 million. The ETF is highly concentrated with finance alone accounting for about 44% of the portfolio holdings. Year-to-date the ETF is up by over 17%.
Disclosure: No Positions