Are International Utilities Attractive Relative To Their U.S. Peers?

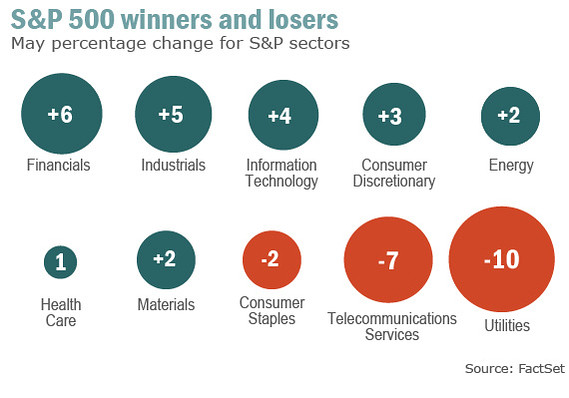
Stocks in the U.S. utility sector are lagging the performance of the overall market so far this year. While the utilities was performing up until recently, last month they fell heavily. The proxy for sector, the SPDR Utilities Select Sector (XLU) was down 8.5% just in last month through the 30th and is up only about 6.0% year-to-date compared to S&P 500’s rise of 14.3% . According to an article in The Wall Street Journal utilities are down for two reasons.

From the Journal article:

Generally slow-but-steady, utility stocks once held strong appeal because of their high dividend payouts and sturdy performance. But rising optimism about the pace of economic growth is prompting ETF investors to move into sectors more closely tied to growth, like technology and industrials.

Others are bailing on utilities because bond yields are rising on speculation that the Federal Reserve might pare back its monthly asset-purchase program. The promise for high payouts from bonds reduces the need to squeeze income from utility stocks, investors say.

While investors are fleeing U.S. utility stocks they may want to consider investing in international utilities. European utility stocks which were on a downward trend for a few years seems to have turned a corner. For example, in the past 5 years, the STOXX® Europe 600 Utilities was down by over 46% but so far this year it is up about 2% excluding dividends.

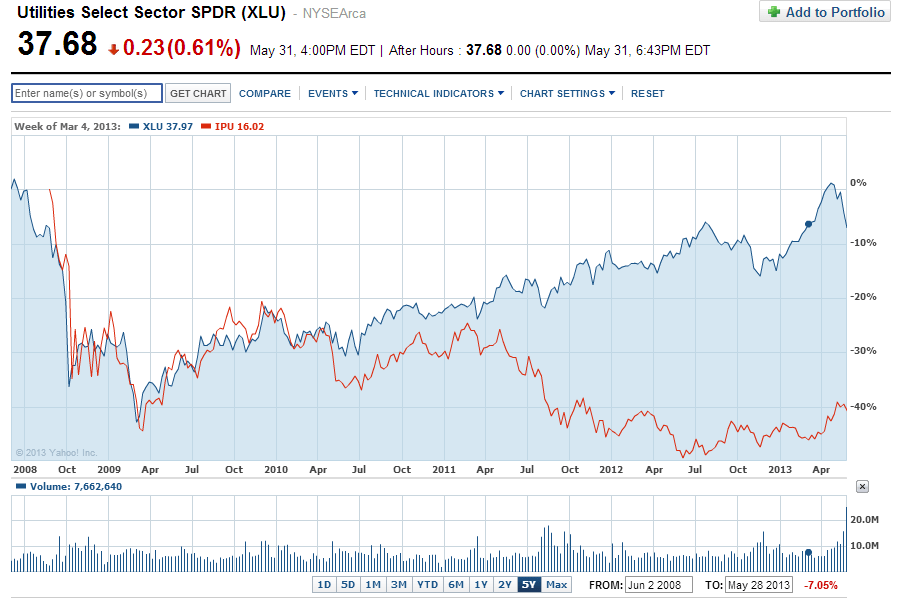
The  SPDR S&P International Utilities Sector ETF (IPU) tracks the performance of the utilities in developed countries excluding the U.S.  The fund is up by 1.72% year-to-date based on price only. This fund can also be considered somewhat as a proxy for European utilities since the majority of the fund’s assets are invested in utility companies of Europe.

5-year chart comparing the performance of XLU and IPU:

Click to enlarge

XLU-vs-IPU-5-Years

1-year chart comparing the performance of XLU and IPU:

Click to enlarge

XLU-vs-IPU-1-Year

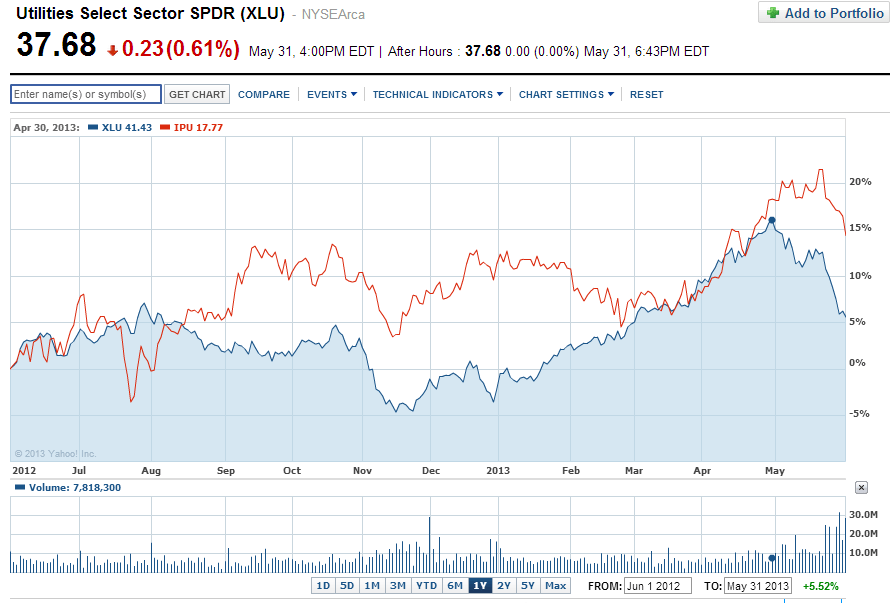
Source: Yahoo Finance

I have used the 1-year chart for comparison instead of year-to-date chart to show the improvement in the international utilities ETF.

The table below shows some of the metrics of the two ETFs:

MetricSPDR Utilities Select Sector (XLU)SPDR S&P International Utilities Sector ETF (IPU) 
Total Net Assets$5.7 Billion$28.8 Million
Dividend Yield3.83%4.06%
Number of Holdings33105
Distribution FrequencyQuarterlyQuarterly


Source: SPDRs

Compared to the ETF for U.S. utilities, the SPDR S&P International Utilities Sector ETF (IPU) has a tiny asset base of over $28.0 million. About 38% of the assets are invested in two countries – the UK and Japan. The top three holdings in the fund are National Grid (NGG) of UK, Germany’s E.ON SE  (EONGY) and GDF Suez SA (GDFZY) of France.

Since international utilities have lagged their U.S. peers for many years and U.S. economic recovery may actually hurt utility stocks investors can consider adding selective foreign utility stocks at current levels.

Disclosure: Long EONGY

Update:

May-Sector-ReturnsSource: Why dividend yield stocks are getting dumped, MarketWatch


The Top 25 Cash-Rich S&P 500 Non-Financial Companies

Large U.S. companies hold billions of dollars in cash and cash-equivalents on their balance sheets. The largest of these 83 companies hold over $1.46 Trillion off-shore beyond the reach of the U.S. government according to a report by Bloomberg in March this year. Companies are hoarding such huge piles of cash overseas since they do not want to pay taxes if repatriated back home.They also hold high amounts cash and equivalents in the U.S. as they are unable to invest them in productive ways. While it would be better for all stakeholders if they put this cash hoard to work by building factories and expanding locally and globally, nowadays management and the boards that are supposed to monitor them in many firms are incompetent, selfish and lazy. They would rather waste shareholder wealth on share buybacks, acquisitions or simply help themselves by dipping into the cookie jar with outrageous pay packages, bonuses, stock options and other legally-allowed compensation schemes.

The table below lists the Top 25 S&P 500 Non-Financial Companies by Cash & Short-Term Investments held on their balance sheets:

S.No.CompanyTickerDividend Yield as of May 31, 2013Cash ($Mil.) as of May 15, 2013Sector
1General ElectricGE3.23%79,390Industrials
2MicrosoftMSFT2.68%74,483Technology
3GoogleGOOGN/A50,098Technology
4CiscoCSCO2.89%46,376Technology
5AmgenAMGN1.78%42,075Health Care
6AppleAAPL2.74%39,137Technology
7OracleORCL0.70%33,407Technology
8PfizerPFE3.31%32,708Health Care
9FordF2.70%32,010Discretionary
10Johnson & JohnsonJNJ3.04%21,089Health Care
11WellPointWLP1.95%20,857Health Care
12ChevronCVX3.19%19,048Energy
13Coca-ColaKO2.65%18,428Staples
14IntelINTC3.75%17,073Technology
15MerckMRK3.65%16,141Health Care
16UnitedHealthUNH1.37%16,088Health Care
17Abbot LabsABT1.48%15.174Health Care
18QUALCOMMQCOM2.18%13,493Technology
19Hewlett-PackardHPQ2.36%13,012Technology
20DellDELL2.40%12,777Technology
21IBMIBM1.85%11,993Technology
22BoeingBA1.83%11,853Industrials
23Freeport-McMoRanFCX4.11%9,595Materials
24HumanaHUM1.37%9,539Health Care
25eBayEBAYN/A9,402Technology


Source:  Where to find higher yields, 4/22/13, Fidelity Investments

Nearly half of the companies noted above tech companies.This is because they generate a larger portion of their revenue overseas and have traditionally paid out low or no dividends to shareholders. As a result they accumulate cash year after year.

The dividend yield on the S&P 500 as of May 7 was 2.15% and the dividend payout ratio was 32%. Of all the sectors in the index, the technology sector was one of the sectors with low dividend yields and payout ratios. While utilities and telecoms had dividend yields of over 4% and 3% respectively, the technology sector had a dividend yield of just 1.81%  and a payout ratio of 22%. The sector accounted for only 15% of the total dividends paid in the index. Since large-cap technology firms hold so much cash and short-term investments on their balance sheet, Fidelity noted that the possibility of potential dividend increases by these firms is high.

Related ETFs:

  • SPDR S&P 500 ETF (SPY)
  • SPDR Technology Select Sector ETF (XLK)
  • SPDR S&P Dividend ETF (SDY)
  • Vanguard Dividend Appreciation ETF (VIG)

Disclosure: No Positions

Ten Companies With Sustainable Competitive Advantages For Long-Term Investment

One of the defining characteristics of Capitalism is competition.  Indeed competition in capitalist countries such as the U.S. is so fierce that thousands of companies go out of business every year since they can’t compete effectively.However it should be noted that “real” competition does not exist in all industries with some dominated by oligopolies or even monopolies. In industries where competition does exist, winners and losers are sorted out by the market.

Firms that have a competitive edge over their rivals thrive in the marketplace and can exist for a very long time. Public companies that fall into this category can produce substantial returns for investors as they are able to capitalize on their competitive advantage. If one or more competitors can copy their ideas or make better products then then the company that had the competitive edge loses that advantage quickly. For example, in the cell phone manufacturing industry, US-based Apple Inc(AAPL) was on top of the world last year due to the explosive popularity of its iPhones and other products. Investors couldn’t get enough of Apple’s stock pushing it well over $700 per share late last year. However mesmerized by the media and hyped by Wall Street they failed to realize that Apple’s competitive advantage is not permanent. Indeed their main advantage was not in the making of the iPhone (hardware) but the software that went into it that made operating the device incredibly easy for a kid, grandma or an adult. Other players in the industry were not going to sit around and let Apple dominate the industry far too long. Companies such as South Korea’s Samsung Electronics went on the offensive by offering cheaper and even better versions of mobile phones taking a sizable chunk of Apple’s market share in a short period of time. Accordingly Apple’s stock price has returned to earth and closed at $449.73 yesterday.

Companies that have multiple and sustainable competitive advantages can offer great returns to shareholders. This includes holding onto to a competitive idea or an advantage over a long time and not lose it like Apple. I recently came across a fascinating article by Ruan Stander, a quantitative and equity analyst and portfolio manager of Allan Gray Proprietary Limited of South Africa.

From the article:

Evidence for sustainable advantages requires a company that has:

1. Been around for a long time.
2. Outperformed the average company consistently.
3. Not changed a lot over time to distort the analysis.

One company that fits the profile is Coca-Cola. The company has been around for 126 years and has faced capitalism’s creative destruction for long enough to be counted as a fair example. Table 1 on page 7 illustrates how Coca-Cola has been able to generate value for shareholders over the short, medium and long term beyond the market average. If an investment in the market in 1919 was worth R1m today, an equal investment in Coca-Cola would be worth R37m.

Click to enlarge

Coca-cola Returns

Note: The investment return amounts noted are in South African Rand (R).

He discussed three competitive advantages that companies such as Coca-Cola hold:

1. Significant benefits to scale (an industry in which being bigger helps to keep costs low).
2. A leading market share (capturing the benefits of [1]).
3. A supply chain that is superior and hard to copy for existing competitors.

A supply chain that is superior and hard to copy for competitors with a reasonable market share

The third point is important since it is the ‘moat’ that turns 1) and 2) into a money-making machine for shareholders. For Coca-Cola the advantages are a bottling and distribution system that is hard to replicate and a recipe that is widely regarded as one of the best kept secrets in business.

Source: Buy OUTsurance, Quarterly Commentary, March 2013, Allan Gray

Nine other U.S. companies that have sustainable competitive advantages are listed below for further research:

I believe most of these companies hold all the three sustainable advantages discussed by Ruan above using Coca-Cola as an example. However I have not validated them. But they satisfy at least the criteria that they have been around for a long time.

1.Company:Colgate-Palmolive Co. (CL)
Current Dividend Yield: 2.22%
Sector:Household Products

In business since 1806, the company owns globally popular brands such as Colgate toothpaste, toothbrushes, Palmolive dishwashing liquid and many others in the household products category. In the time period from 12/31/2092 to 3/31/13, the company’s stock yielded a total return of 1169% compared to just 437% for the S&P 500 and 765% for the peer group which includes The Clorox Company (CLX), Avon products (AVP), Kimberly-Clark (KMB), Procter & Gamble (PG), Unilever NV and plc (UN, UL) and Reckitt Benckiser Group plc(RBGLY).

2.Company:Procter & Gamble Co. (PG)
Current Dividend Yield: 2.94%
Sector:Household Products

P&G  gets 62% of its sales from emerging markets. Some of the company’s products include items such as toothbrush, toothpaste, paper towels. etc. P&G hasn’t changed much from manufacturing and selling these and other household products  since 1837.

3.Company:International Business Machines Corporation (IBM)
Current Dividend Yield: 1.85%
Sector:IT Services

Founded in 1911, IBM is now more of a IT contract services provider than an innovator of new technologies. Capitalizing on its coveted patents and core competencies the company continues to thrive and earned $104.5 billion in revenues last year.

4.Company: Lorillard Tobacco Company (LO)
Current Dividend Yield: 5.01%
Sector:Tobacco

According to the company website, Lorillard is the oldest publicly traded company listed on the New York Stock Exchange and one of the oldest continually operating companies in America. Lorillard celebrated its 250th Anniversary in 2010. Founded in 1760, it is the third largest cigarette maker in the U.S..

5.Company:Exxon Mobil Corporation (XOM)
Current Dividend Yield: 2.75%
Sector: Oil, Gas & Consumable Fuels

Originally founded in 1870, the company today is the world’s largest publicly traded oil and gas company.

6.Company:Johnson & Johnson (JNJ)
Current Dividend Yield: 3.04%
Sector:Pharmaceuticals

Founded in 1886, Johnson & Johnson went public in 1944. J&J has increased dividends for 51 consecutive years.

7.Company:Abbott Laboratories (ABT)
Current Dividend Yield: 1.48%
Sector:Pharmaceuticals

As a major drug company Abbott manufactures many products in the areas of diabetes care, cardiac and vascular diseases, eye care, nutrition solutions, etc. Companies in this sector naturally have an edge over competitors since they hold the patents for the drugs they invented.

8.Company: Lockheed Martin Corporation (LMT)
Current Dividend Yield: 4.30%
Sector:Aerospace & Defense

Lockheed Martin’s history dates back to 1909. The company is a world leader in the aerospace and defense sector with thousands of innovations that are patented.

9.Company:Norfolk Southern Corp (NSC)
Current Dividend Yield: 2.58%
Sector:Road & Rail

Dating back to 1883, Norfolk Southern hasn’t changed much in a very long time other than many mergers and acquisitions. Today it operates about 20,000 route miles in 22 states and DC serving every major container port in the eastern U.S.

Data Sources:

Public companies 100 years old or more, USA Today
Company Sites

Note: Dividend yields noted are as of May 31, 2013. Data is known to be accurate from sources used.Please use your own due diligence before making any investment decisions.

Disclosure: Long NSC, RBGLY

Should You Invest in National Bank of Greece ADR After 2nd Reverse Split ?

National Bank of Greece (NBG) has implemented a reverse split for the 2nd time in less than two years. In November, 2011 when the reverse split went into effect in the ratio 1:5 I noted that investors may want to avoid the stock. On May 30th, the bank reverse split the ADR again. This time they seem to be trying to keep the share price above $1.00 for some time and gave shareholders 1 ADR for each 10 held. After closing at $1.22 on May 29th, the stock opened at $5.70 yesterday and end the day at $7.07. From the reverse split made in November, 2011 to the current split, the stock fell by over 50%.

The long-term performance chart of the bank is shown below:

Click to enlarge

NBG-10-years

Source: Google Finance

In the past 10 years the stock price has plunged by over 75.0% as shown in the chart above.

The Athens Composite Index is up 5.50% year-to-date as investors are betting that the worst is behind the country. Based on this belief,  investors have picked up debt recently from companies such as oil refiner Hellenic Petroleum and dairy producer Fage according to a report in The Journal.

Foreign investors pumped money into Greek stocks lifting the composite index by 33.4% which made Greece the best-performing market in the European Union per another article in The Journal in February.

From the article:

To be sure, it could all go sour again, should social or political tensions erupt anew and derail the fragile three-party governing coalition’s reform program.

Indeed, the economy is expected to contract by 4.5% this year and unemployment is already a staggering 27%. More than nine in 10 households have seen a significant drop in disposable income since the start of the crisis in 2010, while tens of thousands of business are expected to shut down this year, according to traders.

Another risk is trouble in another euro-zone country that could send investors scurrying for safety. A simmering political scandal in Spain and the outlook for reform in Italy following elections that wrap up on Monday are among the bigger worries; both countries have their own financial problems.

And there are also broader concerns about the economic health of the 17-nation block. When February’s preliminary reading of purchasing managers indexes for euro-zone countries slumped to a two-month low, major European stock markets skidded. Greek stocks fell more than 4%.

Source:  Foreign Money Is Revisiting Greece, Feb 24, 2013, The Wall Street Journal

Since Greece has not solved many of the structural economic problems I would stay away from Greek stocks particularly financials. Investors can wait a few more years before jumping into Greek equities.

Related ETF:

Global X FTSE Greece 20 ETF (GREK)

Disclosure: No Positions

Reinvesting Dividends Can Yield Excellent Returns

One of the dilemmas often faced by investors in dividend-paying stocks is if they should reinvest the dividends or not. Reinvesting dividends received from equity investments on a periodic basis such as monthly, quarterly, bi-annually or even annually can substantially boost the total returns earned, especially in the long-term due to the effect of compounding.

The following chart shows the performance of the FTSE All Index of UK with and without dividend reinvested over the past 10 years:

Click to enlarge

Reinvesting-Dividends-Return

Source:  Reinvesting dividends key for growth, says Franklin Templeton’s Morton. FE Trustnet

Note: The blue line shows the Total Return (TR). The returns shown are in British currency terms.

From the article:

Investors who had simply put their money in the FTSE All Share would have seen their money grow by 81 per cent over the last decade, according to data from FE Analytics, but those who had reinvested their dividends over that period would have made 156.15 per cent.

Reinvesting dividends in the FTSE All Share index almost doubled the return for the period noted.

The decision to reinvest dividends depends on many factors like the goal of investment, type of investor, market conditions and so forth. Like any other investment concept, dividend reinvestment also has both advantages and disadvantages.

Some of the pros of dividend reinvesting include:

  • Dividend reinvesting takes the worry of trying to figure out where to invest the dividend amounts received every time.
  • The automatic reinvestment of dividends option offered by most brokers can make the reinvestment process easy and systematic.
  • Most brokers reinvest the dividends for free without any commissions thus helping an investor acquire new shares without costs.
  • In declining and volatile markets, an investor can pick more shares cheaper by reinvesting dividends.
  • Dividend-payers that consistently increase dividends can help to accumulate additional shares when held over many years thereby increasing the total returns.

Some of the cons of dividend reinvesting include:

  • This strategy deprives an investor of the ability to invest in some other stock or asset which may higher potential for growth.
  • Reinvesting dividends in low quality companies or some sectors may not yield the best result. For example, it is not a wise idea to reinvest dividends in tech stocks since not only are the yields low but companies in the sector can go out of favor or even out of business almost overnight due to changes in the unpredictable industry.
  • Taxes have to be paid in the years when dividends are earned from stocks held in taxable accounts. If a crisis such as the global financial crisis erupts and the company’s stock becomes worthless, an investor not only lose the original investment but also all the dividends earned and the taxes paid.
  • Dividend payments are discretionary and can be cut for any or no reason by a company. When this happens, investors are likely to dump the stock wiping out years of price growth. An investor who was loyal to the company and reinvested every cent of dividend for years will lose out on gains.Hence selecting high-quality well established companies is important.
  • If a broker charges a commission to reinvest dividends then reinvesting dividends will not be highly beneficial.

Despite the cons noted above, dividend reinvestment can be an excellent tool to build long-term wealth. However instead of blindly plowing back the dividends into their current holdings, investors have to be selective in picking companies for dividend reinvestment.

Ten British stocks that investors can consider for long-term investment are listed below with their current dividend yields:

1.Company: Unilever PLC (UL)
Current Dividend Yield: 2.97%
Sector: Food Products

2.Company: British American Tobacco PLC (BTI)
Current Dividend Yield: 3.78%
Sector:Tobacco

3.Company: Vodafone Group PLC (VOD)
Current Dividend Yield: 5.19%
Sector: Telecom

4.Company: HSBC Holdings PLC (HBC)
Current Dividend Yield: 4.16%
Sector: Banking

5..Company: Imperial Tobacco Group PLC (ITYBY)
Current Dividend Yield: 4.60%
Sector: Tobacco

6.Company: AstraZeneca PLC (AZN)
Current Dividend Yield: 5.37%
Sector: Pharmaceuticals

7.Company: Legal & General Group PLC (LGGNY)
Current Dividend Yield: 3.80%
Sector: Financial Services

8.Company: Reed Elsevier PLC (RUK)
Current Dividend Yield: 2.08%
Sector: Media

9.Company: GlaxoSmithKline PLC (GSK)
Current Dividend Yield: 4.51%
Sector: Pharmaceuticals

10.Company: Diageo PLC (DEO)
Current Dividend Yield: 2.31%
Sector: Beverages

Note: Dividend yields noted are as of May 30, 2013. Data is known to be accurate from sources used.Please use your own due diligence before making any investment decisions.

Disclosure: Long LGGNY