European Utility Stocks Are Rebounding

Utility stocks were once considered to be safe, slow and steady growers. For years they were the favorite of income investors as utilities generally had a  high dividend yield relative to other sectors and for the most part they were dull and boring. With the deregulation of the industry the stability and steady growth was gone. This was true both in the U.S. and Europe. Utility stocks were no longer dependable for the steady income and growth and they started to act like stocks in other volatile sectors. A recent article in The Economist noted that the top 20 European utilities have lost about half a trillion Euros since their peak in 2008.

From the article:

The decline of Europe’s utilities has certainly been startling. At their peak in 2008, the top 20 energy utilities were worth roughly €1 trillion ($1.3 trillion). Now they are worth less than half that (see chart 1). Since September 2008, utilities have been the worst-performing sector in the Morgan Stanley index of global share prices. In 2008 the top ten European utilities all had credit ratings of A or better. Now only five do.

Click to enlarge

European-utilities

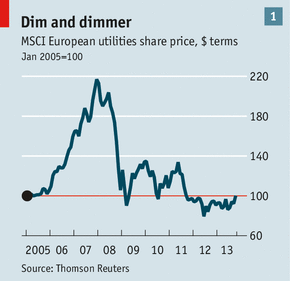
As the chart shows above, European utilities are a long way from reaching the 2008 peak again. Though the overall equity markets have rebounded strongly in the five years, this sector went nowhere but down until last year. Now the sector is rebounding although at a slower pace than say the banking sector.

On the problems facing European utilities, The Economist article noted the following:

Two influences from outside Europe added to the problems. The first was the Fukushima nuclear disaster in Japan. This panicked the government of Angela Merkel into ordering the immediate closure of eight of Germany’s nuclear-power plants and a phase-out of the other nine by 2022. The abruptness of the change added to the utilities’ woes, though many of the plants were scheduled for closure anyway.

The other influence was the shale-gas bonanza in America. This displaced to Europe coal that had previously been burned in America, pushing European coal prices down relative to gas prices. At the same time, carbon prices crashed because there were too many permits to emit carbon in Europe’s emissions-trading system and the recession cut demand for them. This has reduced the penalties for burning coal, kept profit margins at coal-fired power plants healthy and slashed them for gas-fired plants. Gérard Mestrallet, chief executive of GDF Suez, the world’s largest electricity producer, says 30GW of gas-fired capacity has been mothballed in Europe since the peak, including brand-new plants. The increase in coal-burning pushed German carbon emissions up in 2012-13, the opposite of what was supposed to happen.

Source:  European utilities – How to lose half a trillion euros, The Economist

The STOXX® Europe 600 Utilities Index composed of 26 of the major utilities in Europe is showing signs of recovery. In the past 5 years the index is down over 19% in Euro price terms. However the 2-year and year-to-date returns are over 2% and 7% respectively.

Investors looking to gain exposure to European utilities can consider some of them at current levels. Ten such companies are listed below with their current dividend yields:

1. Company:Electricite de France SA (ECIFY)
Current Dividend Yield: 4.64%
Country: France

2.Company:National Grid PLC (NGG)
Current Dividend Yield: 5.11%
Country: UK

3. Company:Edp Energias De Portugal SA (EDPFY)
Current Dividend Yield: 4.25%
Country: Portugal

4.Company: E.ON SE (EONGY)
Current Dividend Yield: 5.67%
Country: Germany

5. Company: RWE AG (RWEOY)
Current Dividend Yield: 7.01%
Country: Germany

6. Company: Enel SpA (ENLAY)
Current Dividend Yield: 4.45%
Country: Italy

7. Company: Fortum Oyj (FOJCY)
Current Dividend Yield: 5.69%
Country: Finland

8.Company:SSE PLC (SSEZY)
Current Dividend Yield: 5.65%
Country: UK

9. Company: Verbund AG (OEZVY)
Current Dividend Yield: 3.23%
Country: Austria

10.Company: Gas Natural SDG SA (GASNY)
Current Dividend Yield: 4.81%
Country: Spain

Note: Dividend yields noted are as of Oct 22, 2013. Data is known to be accurate from sources used.Please use your own due diligence before making any investment decisions.

Disclosure: Long EONGY, RWEOY

Knowledge is Power: European Stocks, Safest Banks 2013, Terrifying Valuations Edition

With stocks, bigger isn’t better: Andrew Hallam (Canadian Business)

Buy your fund manager (Canadian Business)

5 things investors should fear (Financial Post)

The biggest EM in the world: the US (beyondbrics)

Buy, sell or hold: Should you put Tesco in your portfolio? (Trustnet)

Henderson’s O’Gorman: tech stocks hitting ‘terrifying’ valuations (CityWire)

Now is the time to invest in European equities (The Asset)

Chart: The Mad Rush Into European Stocks (Brazilian Bubble)


Dividend Growth of S&P 500 From 1972 To 2012

The current yield on the S&P 500 Index is 2.08%. The yield has stayed around the 2% range for many years now. However the dividend amounts paid out components in the index has increased over the years especially in the long run. The following chart shows the dividends paid per share and the yield on cost from 1972 to 2012. The Yield On Cost simply denotes the yield on the cost of investment. So the Yield on Cost on a $100 investment in a stock paying $10.0 in year 1 would be 10%. The following year the Yield On Cost would be higher if the dividend paid was lets say $11.0. If the dividends paid out increases year after year then the Yield On Cost would also increase accordingly.

Click to enlarge

SP500-Dividend-Growth

Source:The Case for a High and Growing Dividend Stock Strategy in Retirement Portfolios, Thornburg Investments, June 2013

From the Thornburg research study:

Figure 1 assumes if you bought one share of the S&P 500 Index on December 31, 1969, it would have cost you $92.06. In each subsequent year you chose to spend the dividends rather than reinvest them. In 1970, you would have received dividends totaling $3.14, for a 3.41 percent yield on cost; by 1980, your annual dividend would have increased to $6.16,
for a 6.69 percent yield on cost; in 1990 you would have received $12.09, for a 13.13 percent yield on cost; and in 2012 you would have received $31.25, for an attractive 33.95 percent yield on cost. In fact, the average annual increase of the dividends over the entire 43-year period was 5.89 percent. (emphasis added)

While the dividend yield is low on the S&P 500, the average annual increase in dividends is decent over the period shown above.

Related ETF:

  • SPDR S&P 500 ETF (SPY)

Disclosure: No ETF


On The Correlation Between Economic Growth And Stock Returns

The correlation between a country’s economic growth and equity market returns is very low especially in the long-run. Many studies have confirmed that high economic growth does not translate into high equity returns for investors. For example, developed equities have yielded higher returns than emerging equities in the past few years despite the lower economic growth in the developed world than emerging countries.

A recent research report published by Vanguard showed that there is a weak correaltion between long-run equity market returns to their economic growth (as measured by real GDP growth) across 46 countries.

Click to enlarge

Econmic-Growth-vs-Stock-Returns


Source: The outlook for emerging market stocks in a lower-growth world, September, 2013 Vanguard Group

From the report:

At 4.0% per year, the average real equity market return for the countries with the three highest GDP growth rates was slightly below the 4.2% average return for the countries with the three lowest GDP growth rates, despite the considerable difference in those rates (8.0% a year versus 1.6%, on average). It is clear that the correlation between these two variables is weak.

China is a classic case validating the above theory. Though China has the highest Real GDP Growth for the period shown above, the real equity market return has been lower. On the other hand, Germany has had a Real GDP Growth of about 2% but German stocks performed much better yielding over 5%.

Similar to Germany, equity returns are higher than economic growth for the U.S. also. In general it can be argued that developed countries can never have the same type of economic growth as emerging countries since they are already developed. For instance, basic infrastructure such as roads, bridges, ports, railroads, etc. already exist in the developed world while in many emerging countries they are being built only now. However developed countries offer many advantages like political stability, currency stability, transparency, lack of corruption, strong legal system, etc. Most emerging markets do not have these features. Hence investors are willing to pay a premium for developed equities even with a lower economic growth than emerging countries.

China’s Central bank projects the GDP growth to exceed 7.5% this year. The Federal Reserve forecasts the U.S. economic growth between only 2% and 2.3% this year. But in terms of  stock market returns the S&P 500 is up over 19% year-to-date as of Oct 15th compared to -1.6% for the Shanghai Composite Index.

The main point that investors should remember  is simply investing in equities because of high economic growth in a country would not necessarily mean higher returns.

Related ETFs:

  • iShares MSCI Emerging Markets Indx (EEM
  • Vanguard Emerging Markets ETF (VWO)
  • SPDR S&P 500 ETF (SPY)
  • iShares MSCI Brazil Index (EWZ)
  • iShares FTSE/Xinhua China 25 Index Fund (FXI)

Disclosure: No Positions

Tire Maker Bridgestone Corp’s Stock Split

Japan-based Bridgestone Corp is the world’s largest tire maker in terms of sales revenues from tires only. The company’s annual tire sales revenue exceeds $28.6 billion.

Bridgestone’s stock trades as an unsponsored ADS on the OTC market under the ticker BRDCY. Today the stock closed at $71.60.

Until today, one ADS represented two ordinary shares. Due to a 300% stock distribution (4 for 1), the ratio changes to two ADS represented one ordinary shares. The ADR record date is Oct 15, 2013 and the Payable date is Oct 16, 2013.

From a corporate action notice issued the depository Deutsche Bank:

As a result of the ratio change, ADS holders of Bridgestone Corp will receive three (3) additional ADSs for every existing ADS held as of the ADR record date.

Here is the 5-year performance of Bridgestone ADS:

Click to enlarge

BRDCY-LT-Returns

Source: Yahoo Finance

The company will announce the 3Q, 2013 earnings on Nov 7, 2013.

Some of the competitors of Bridgestone are Cooper Tire & Rubber Co. (CTB), Continental AG (CTTAY) and The Goodyear Tire & Rubber Company (GT).

Disclosure: No Positions