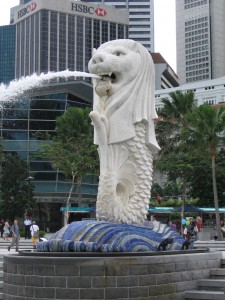
Crude Oil Prices Chart From 1861 To 2012

Crude oil prices(WTI) closed at $103.84 on Oct 4, 2013. Prices fell below $50.0 per barrel at the peak of the global financial crisis but has recovered to stay in the $100 range in the past few years.

The following chart shows crude oil prices in both nominal and real terms from 1861 to 2012:

Click to enlarge

Crude-Oil-Prices-1861-2012

Source: Sasol: A history of underestimation,  Rory Kutisker-Jacobson, Allan Gray

While prices remained stable for years after 1971 it took off. Since 2000 prices have soared to astronomical levels.

From the article:

The question then becomes: Why is the oil price high, and, more importantly, is a significant decline in the future likely?

Unlike many commodities, the oil market is somewhat unique in that the swing producer is one of the lowest cost producers. Roughly 43% of world production comes from the Organisation of the Petroleum Exporting Countries (OPEC), with Saudi Arabia being the largest producer. Saudi Arabia is also the only OPEC country with significant spare capacity. While the pure cost of extraction in Saudi Arabia is low, the vast majority of government revenue is derived from the sale of oil, which is used to subsidise other industries and social welfare. Current estimates are that Saudi Arabia needs an oil price of between US$90 and US$100 per barrel to balance its fiscal budget. It is in the Saudis’ best interests to manage the supply of oil to maximise their revenue per barrel without encouraging demand destruction.

The formation of cartels is illegal in all industries except OPEC. This cartel for the most part determines the price of oil in the global market.  Here is a definition of cartel from Wikipedia:

cartel is a formal (explicit) “agreement” among competing firms. It is a formal organization of producers and manufacturers that agree to fix prices, marketing, and production.

It is interesting how countries such as Saudi Arabia are legally allowed to manipulate the prices in order to balance its budget.

Related ETFs:

  • United States Oil (USO)

Disclosure: No Positions

The Top Five Banks in Argentina Based on Tier 1 Capital

The Top Five Banks in Argentina based on Tier 1 Capital at the end of last year are listed below:

Click to enlarge

Top-5-banks-in-Argentina

Source: The Banker

Banco Macro(BMA) and BBVA Banco Frances (BFR) trade on the U.S. markets and both are up over 29% and 27% respectively YTD. Banco Macro has suspended its dividends and has not paid a dividend for the past two years. BBVA Banco Frances has also not paid a dividend since 2011.

Argentina is involved in a nasty fight with hedge fund primarily led by Elliott Management. An update at FT beyondbrics blog on this legal dispute notes that the U.S. Supreme court has not ruled on Argentina’s appeal after a lower court ruled in favor of the “vulture funds”. Meanwhile the legal saga may continue into next year.

Disclosure: Long BMA

Household Financial Assets By Asset Type Across Select OECD Countries

Financial assets held by households vary widely across countries. In the developed world, households hold a higher portion of their financial assets in equities compared to the emerging world where equities are not as popular for a variety of reasons. Among developed countries, the percentage of households’ financial assets held in various asset classes such as stocks, bonds, insurance, bank deposits, etc. varies from one country to another.

The following chart shows the household financial assets by type of assets held in select OECD countries:

Click to enlarge

Household-Fin-Assets-OECD-Countries

Source:  The Influence of Demographics on Stock Markets of Alejandra Grindal, Ned Davis Research, Inc. in onInvesting, Summer 2013, Charles Schwab

U.S. households hold the highest portion of their financial assets in individual stocks followed by Sweden. Japan has the lowest number of households invested in individual stocks. This is not surprising since ordinary Japanese have pretty much ignored their stock markets since the asset bubble collapse of the early 90s. Even today Japanese have one of the lowest stock market participation rates in the world despite a big run in the Nikkei due to Abenomics introduced the Prime Minister Shinzo Abe.

Since stocks are also present in mutual fund shares, life insurance reserves, and pension funds, Alejandra Grindal, Senior International Economist at Ned Davis Research, Inc estimates that equities make up about 50% of total household financial assets in the U.S.  Americans also hold the lowest percentage of their financial assets in cash relative to  Japan at 54%, Germany at 40% (not shown in chart) and the UK at 28%. German, French  and British households invest a high portion of their financial assets in life insurance policies. Hence it may be wise to invest in life insurers such as Legal & General Group Plc (LGGNY),  AXA Group (AXAHY) and Allianz SE (AZSEY).

For more details on stock  market participation rates globally you can checkout my article earlier this year.

Disclosure: Long AXAHY

Foreign Stocks Trading At Over $100 Per Share

One of the survivors of the dot-com era is the online travel company priceline.com Inc (PCLN). Yesterday its stock price closed at $1,062.17 per share. The share price first crossed the $1,000.00 on September 20th.

So I was wondering which foreign stocks traded above $100.00 per share. According to BNY Mellon data, the following 14 foreign stocks closed at over $100.00 per share on Oct 4, 2013.

S.No.CompanyTickerShare Price as of Oct 4,2013IndustryCountry
1China National Offshore Oil-CNOOCCEO$206.80Oil & Gas ProducersChina
2Novo NordiskNVO$166.16Pharma. & Biotech.Denmark
3BaiduBIDU$159.00Software&ComputerSvcChina
4Toyota MotorTM$128.01Automobiles & PartsJapan
5Coca-Cola FemsaKOF$126.91BeveragesMéxico
6DiageoDEO$125.68BeveragesUnited Kingdom
7SiemensSI$123.05General IndustrialsGermany
8ShireSHPG$118.33Pharma. & Biotech.United Kingdom
9Grupo Aeroportuario del SuresteASR$114.14IndustrialTransport.México
10PetroChinaPTR$111.72Oil & Gas ProducersChina
11British American TobaccoBTI$102.77TobaccoUnited Kingdom
12ASMLASML$100.96Tech.Hardware&Equip.The Netherlands
13WPPWPPGY$100.89MediaUnited Kingdom
14KyoceraKYO$100.34Electron.&ElectricEqJapan


Source: BNY Mellon

Though a share price of above $100.00 does not mean anything, these companies are still worth keeping an eye on as there is a possibility that they may split their stock prices to make them more attractive for retail investors.

Disclosure: No Positions

Time To Invest In British Stocks ?

British equities are lagging in performance over their developed world peers so far this year. The FTSE 100 is up only 9.4% while the S&P 500, Germany’s DAX and France’s CAC-40 are up by 18.5%, 13.3% and 14.4% respectively.The following chart shows the year-to-date performance of FTSE 100 (in blue) against these three major indices:

Click to enlarge

FTSE100-vs-Other-Indices

Source: Yahoo Finance

Up until mid-August the FTSE tracked or performed better than DAX and the CAC-40 indices. However when emerging markets started to fall due to the sudden depreciation of their currencies against the dollar and other economic issues, the FTSE followed. This is because unlike the DAX and CAC-40, the FTSE 100  is composed of companies that have high exposure to emerging countries. In fact, some major companies in the index generate over half of their annual revenues from emerging countries. So as emerging markets started to unravel the FTSE 100 was more impacted than the DAX and CAC-40.

The top five constituents of the FTSE 100 are:

1.HSBC Holdings  – Banking

2. Vodafone Group  – Mobile Telecom

3. BP – Oil & Gas Production

4. GlaxoSmithKline  – Pharmaceuticals & Biotechnology

5.Royal Dutch Shell A  –  Oil & Gas Production

All the above five firms are global multinationals with a strong presence in developing countries. For example, Vodafone  was able to offset growth decline in European countries with strong growth in developing countries such as India, Turkey and Ghana.

As emerging markets have stabilized in recent weeks the sell-off in British stocks looks overdone and they are poised for a rebound. Hence investors looking to add some exposure to emerging markets can consider adding some of the major British companies at current levels. An added advantage for U.S. investors in British stocks is that the withholding tax rates on dividends paid out by U.K. corporation is 0%. However dividends paid by U.K. REITs are taxed at 20%.

Ten British stocks trading on the U.S. markets are listed below to consider with their current dividend yields:

1.Company: Vodafone Group PLC (VOD)
Current Dividend Yield:4.43%

2.Company: HSBC Holdings PLC (HBC)
Current Dividend Yield: 4.29%

3.Company: British American Tobacco PLC(BTI)
Current Dividend Yield: 3.97%

4.Company: GlaxoSmithKline (GSK)
Current Dividend Yield: 4.70%

5.Company: BP PLC (BP)
Current Dividend Yield: 5.05%

6.Company: AstraZeneca PLC (AZN)
Current Dividend Yield: 5.41%

7.Company: Diageo PLC (DEO)
Current Dividend Yield: 2.27%

8.Company: Aviva PLC (AV)
Current Dividend Yield: 3.35%

9.Company: Barclays PLC (BCS)
Current Dividend Yield: 2.30%

10.Company: Bhp Billiton PLC (BBL)
Current Dividend Yield: 3.89%

Note: Dividend yields noted are as of Oct 4, 2013. Data is known to be accurate from sources used.Please use your own due diligence before making any investment decisions.

Disclosure: No Positions