The DAX Index is the German equity market’s benchmark index. The index is similar to the Dow Jones Industrial Average in that it is comprised of 30 blue-chip companies traded on the Frankfurt Stock Exchange.
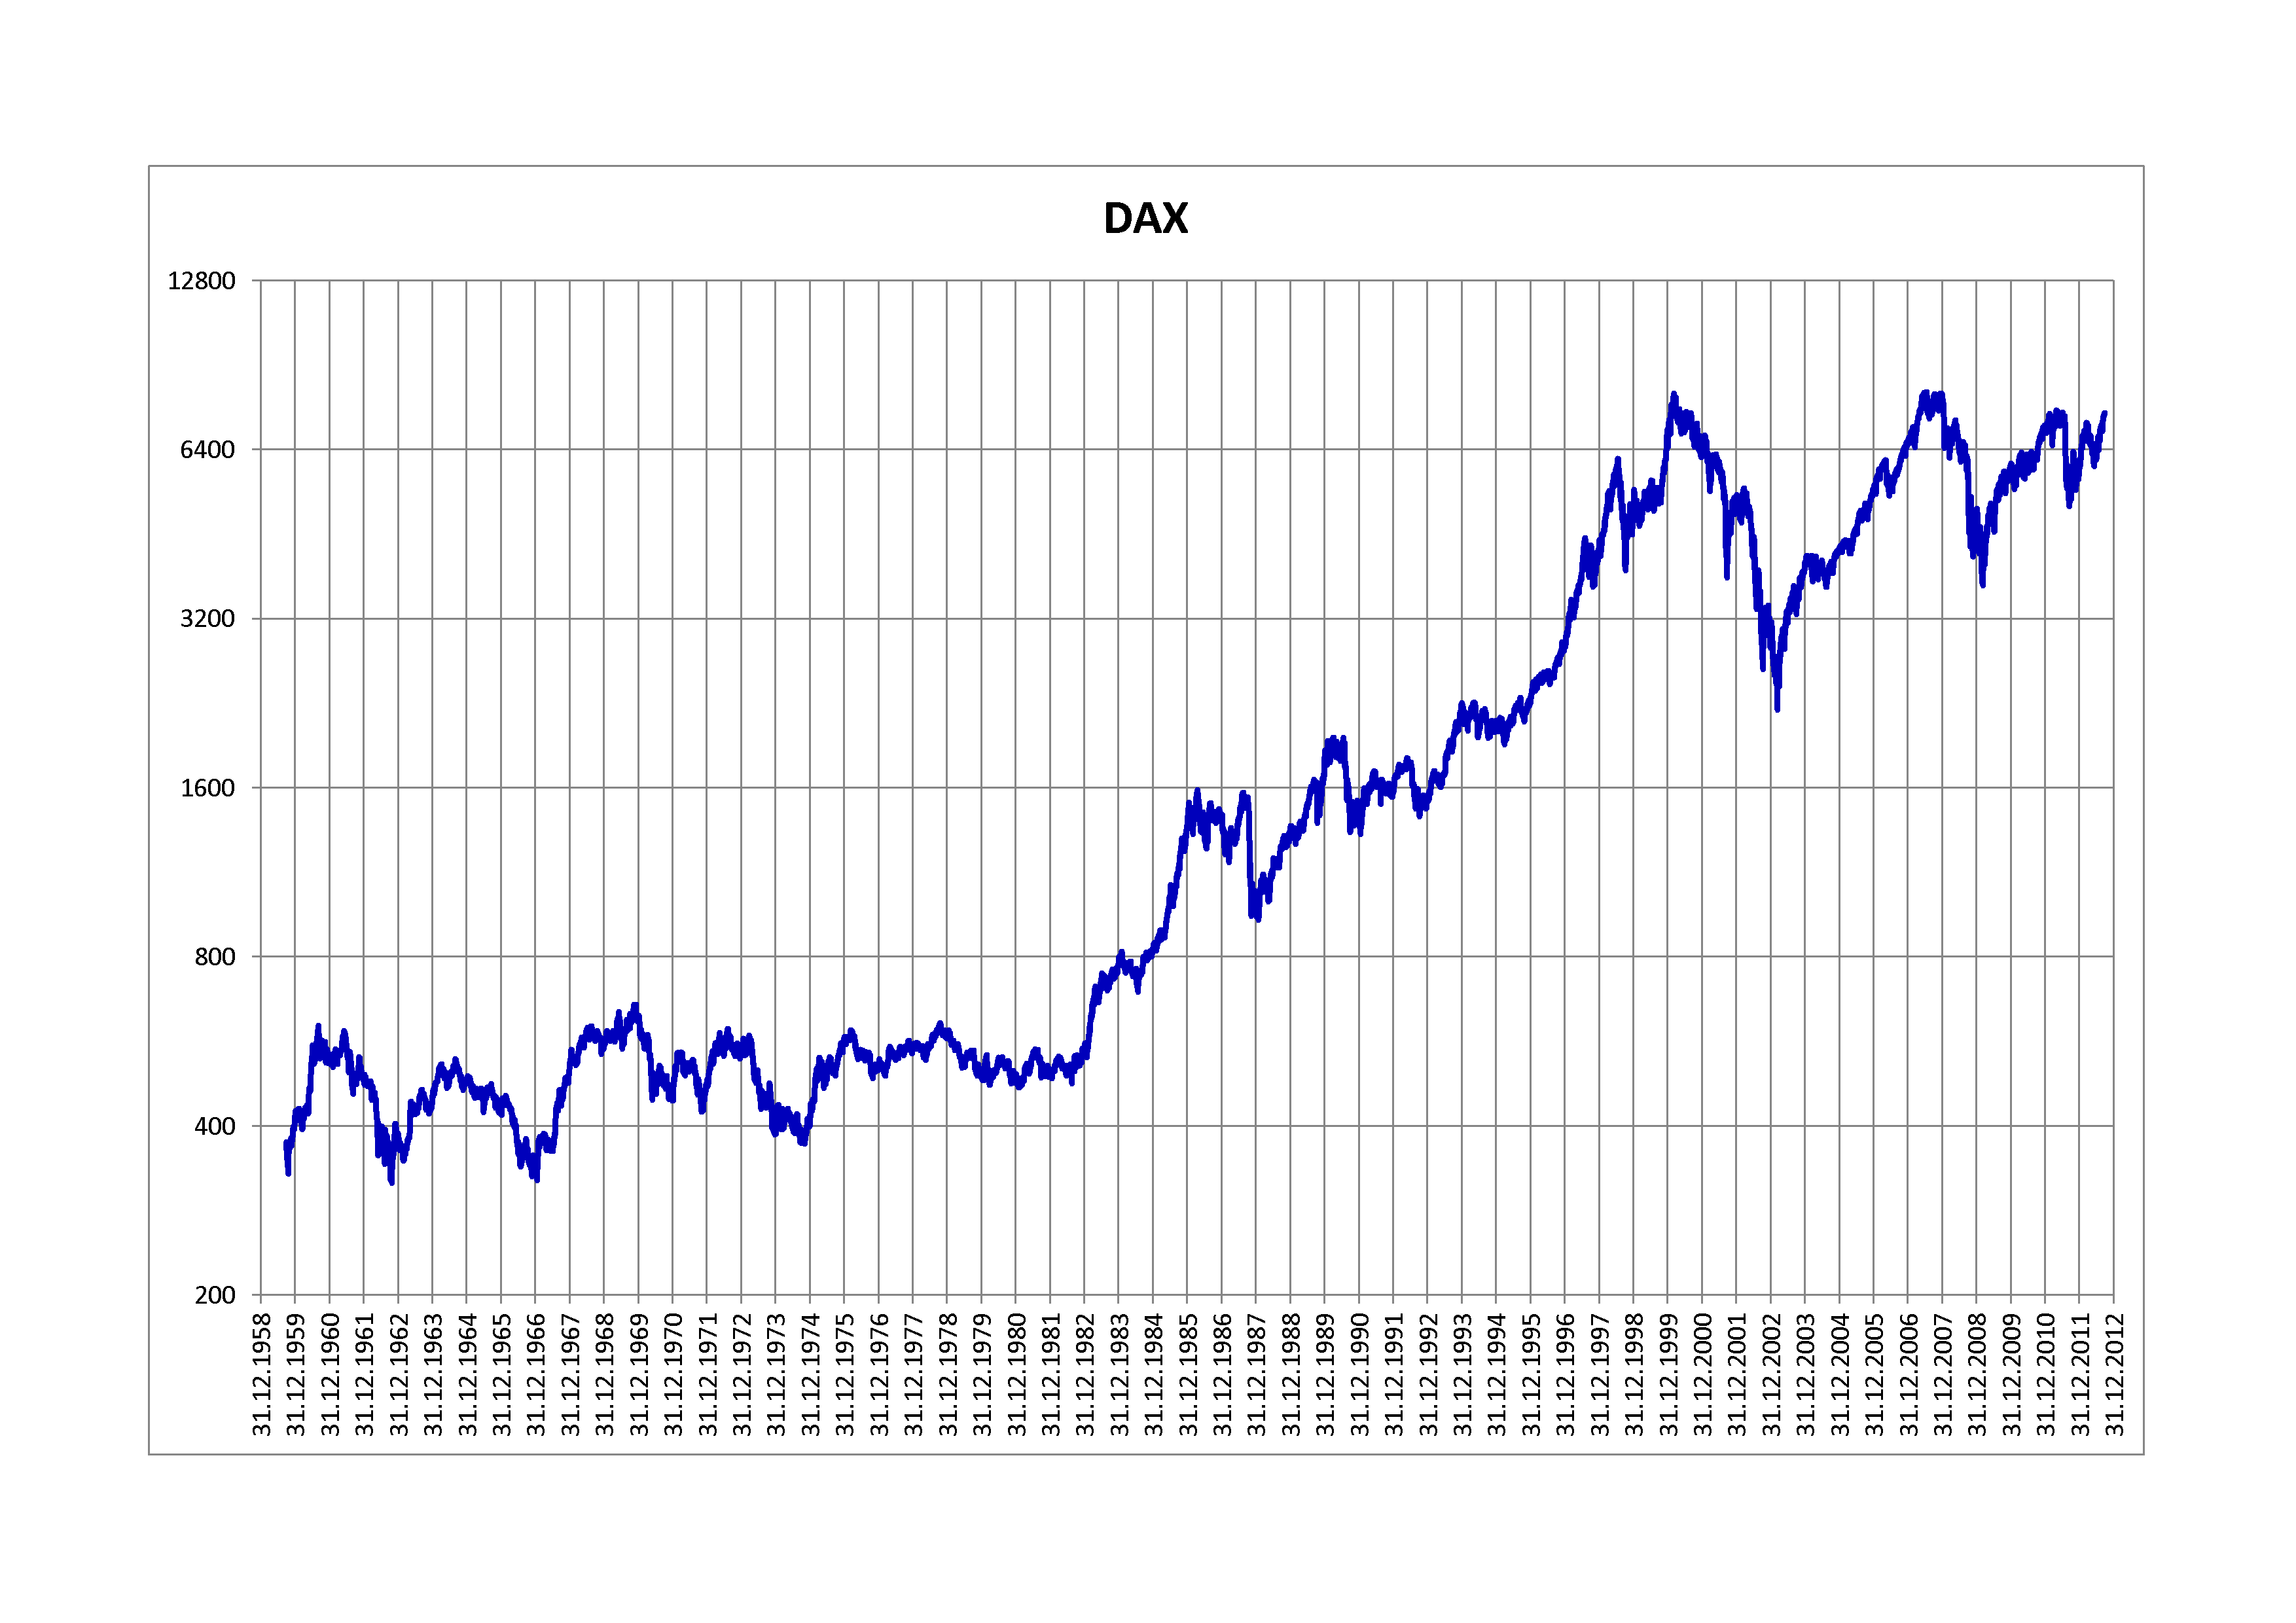
DAX had a base value of 1,000 as of Dec 31, 1987. Yesterday it closed at 9,497.84. The chart below shows the performance of DAX since 1958:
Click to enlarge
Source: Wikipedia
While the DAX mostly stayed flat up until 1983 it took off after that year.
The following chart below shows the DAX returns by year from 1955 to 2012:
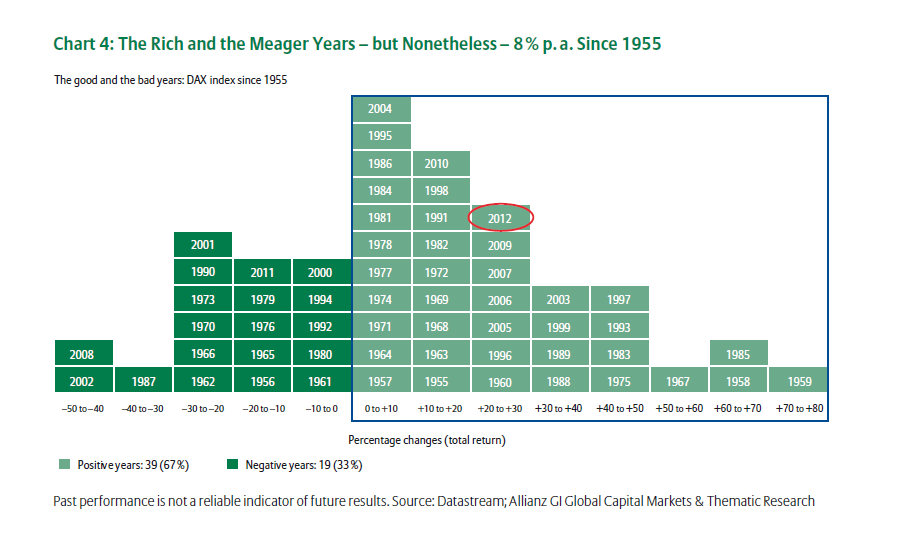
Source: 25 Years of the DAX:Wealth for Everyone, Allianz Global Investors
Writing in the above referenced research report, Hans-Jörg Naumer, Global Head of Capital Markets & Thematic Research Allianz Global Investors noted the interesting fact on the long-term performance of DAX:
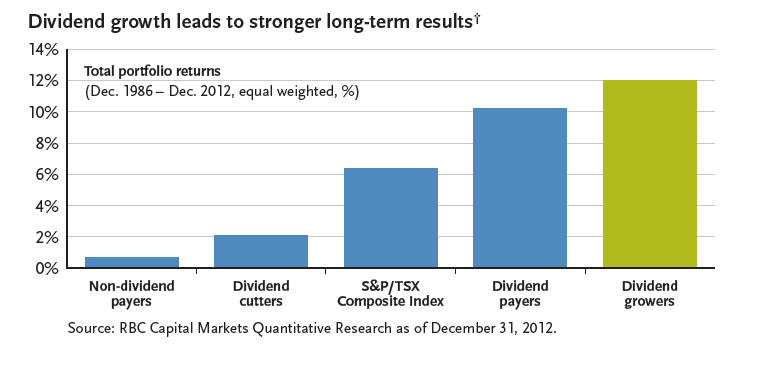
In hindsight, there is no doubting that the DAX has created wealth. It has increased more than eightfold in its nearly 25 years of existence. Put another way: Someone who put 1,000 (or close to 2,000 DM) euros into the DAX back then would have around 8,500 euros at the end of May 2013. It has been,despite all the highs and lows, a good investment.It’s interesting to note: 46 % of DAX performance came from dividend distributions.
Two other points called out by Mr.Naumer are:
- The DAX has generated 7.9% per annum in the past 25 years while German government bonds yielded 6.8% on an average.
- Since 1955 the returns have been mostly positive in the vast majority of the years. In 39 years the returns were positive compared to 19 years in which returns were negative.
During the global financial crisis of 2008, the index fell between 40% to 50%. However since then it has generated positive total returns every year except 2011. Similar to the US equity markets the DAX also posted solid gains in the late 1990s during the high-tech boom years. For example, the index had a total return of 30 to 40% in 1999 .
Related ETF:
- iShares MSCI Germany Index Fund (EWG)
Disclosure: No Positions