The definition of alchemy according to Mirriam-Webster:
a science that was used in the Middle Ages with the goal of changing ordinary metals into gold.
a power or process that changes or transforms something in a mysterious or impressive way.
U.S. companies are desperately trying to show earnings growth measured in terms of earnings per share even though the underlying earnings trend is flat to negative. One way they are able to do this is via share buybacks per Niels C. Jensen of Absolute Return Partners LLP of UK. In the Dec 2013 edition of The Absolute Return Letter he used the following chart on this subject originally put out by PIMCO:
Click to enlarge
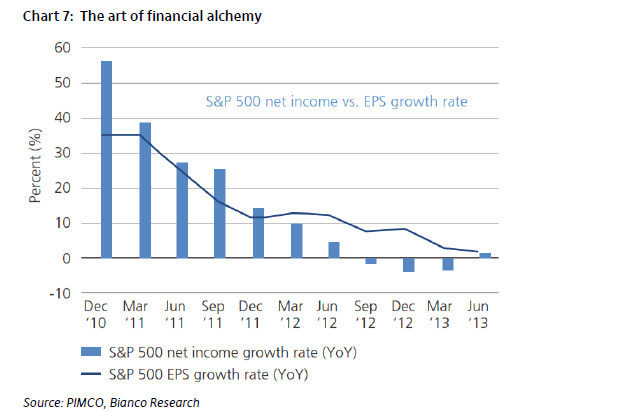
Source: The Absolute Return Letter, Dec 2013, Absolute Return Partners LLP
Share buybacks are rarely used by firms in countries outside of the U.S. However share buybacks very common among US companies of all sizes. Companies routinely implement buyback programs to boost EPS.
When a company starts a buyback program it simply means that the management is incompetent and has no clue what to do with the earnings. In the past US firms used to smart and invest their earnings in R&D, expansion of operations, hire more workers, etc. However nowadays US firms take the easy way out by simply buying buying back their own stock. Obviously one does not need to be a rocket scientist to boost EPS this way but thats what lavish-paid management executives do anyway. Most US investors also go along with the ride since they believe higher share prices are better than dividends due to tax impacts and reinvestment risk. It can be argued that the major shareholders such as hedge funds, mutual funds, wealthy investors, pension funds, institutions, etc. who can actually force a company’s management to use profits in a productive fashion are actually silent supporters of higher stock prices than dividends or growing the company. Hence US firms continue to play the buyback game with no questions asked.
From an article in The Wall Street Journal in later December, 2013:
U.S. companies in the S&P 500-stock index bought back $128.2 billion of their own shares in the third quarter, according to S&P Dow Jones Indices. That is the highest level since the fourth quarter of 2007.
Combined, stock buybacks and dividends totaled $207 billion in the third quarter, also the highest in nearly six years, according to the data provider.
Among the biggest buyers of their own shares in the third quarter were Apple Inc.,AAPL -2.45% Pfizer Inc. PFE -0.26% and Exxon Mobil Corp. XOM +0.22% All purchased more than $3 billion of stock in the three months ended Sept. 30. Apple bought back $4.9 billion. Buybacks are good for shareholders and companies alike: They return cash to investors while boosting companies’ earnings per share by reducing their share count.
The big payouts are luring investors to the stock market—bolstering confidence in stocks’ record-setting rally—at a time when other assets such as bonds are offering paltry or negative returns.
But the moves also are cause for concern for some investors, especially because they come when markets are at records and share valuations are above their historical average.
Some investors are starting to question the popularity of buybacks, saying they would get a better return if companies spend on research and development and on expanding operations.
Source: Companies Binge on Share Buybacks, The Wall Street Journal, Dec 25, 2013
Here is Joshua Brown, financial advisor at Ritholtz Wealth Management and blogger at of The Reformed Broker putting the astonishing buyback amounts in perspective:
In the 12 months ending September 30th, buybacks totaled a whopping $445.3 billion, a year-over-year increase of 15% says S&P Dow Jones Indices. Let me put that $445.3 billion annual run-rate in perspective for you:
* For starters, that amount is equivalent to the annual budget of the entire US Department of Defense ($440 billion). It’s also two-and-a-half times all Federal income taxes paid by corporations ($181 billion last year).
* It’s more than four times greater than the total amount of net inflows to stock mutual funds and ETFs this year ($106 billion).
* It eclipses the total charitable contributions that Americans give each year ($300 billion) by more than 30%.
* You could hold the Beijing Olympics ($41 billion) ten more times for this amount of money or feed every single child in the world for a year ($54 billion) eight times over. Or you could buy up more than half of all the buildings and real estate in Manhattan ($802 billion).
* You could clean up after Hurricanes Sandy, Ivan, Ike, Andrew, Katrina and Ivan. Twice. Or buy out McDonalds, Taco Bell, Pizza Hut, KFC, Wendy’s, Burger King and Chipotle ($150 billion) thrice.
* Adjusted for inflation, this $445 billion is just shy of the total amount the US government spent on the New Deal economic recovery package ($500 billion in today’s dollars) that brought us back from the Great Depression and about four times the size of the Marshall Plan that rebuilt Europe after WWII ($115 billion in today’s dollars).
* You could take this $445 billion and buy every single team in the NFL, NHL, NBA and Major League Baseball – all 122 franchises (estimated by Forbes to be worth a combined $77 billion) – five times and still have enough left over to buy out ESPN ($60 billion) to air all their games.
US corporations took care of their shareholders over this past year like almost never before – but it wasn’t out of altruism. In a low-growth environment the easiest way to boost share prices, raise earnings per share and secure higher compensation is by shrinking the publicly available float of shares. It’s less risky career-wise for a CEO or a board of directors than expansion or acquisitions – and if you can augment a cash hoard with debt financing at almost zero cost, why not?
Source: Merry F%@#ing Buyback Christmas, The Reformed Broker
Related ETF:
PowerShares BuyBack Achievers Portfolio (PKW)
Disclosure: No Positions