Chart: Comparing the Performance of Bovespa, Sensex and S&P 500

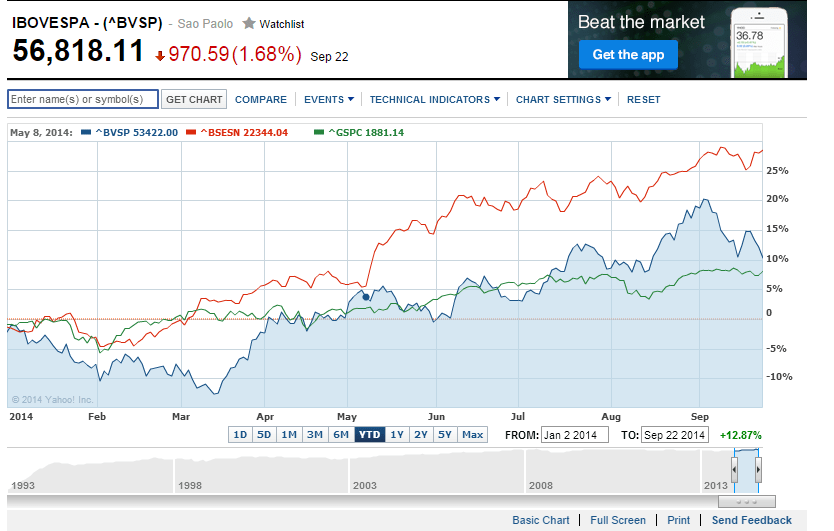
Brail’z Bovespa is up 10.3% year-to-date while India’s Sensex is up 28.5%. The S&P 500 is up by 7.90% YTD.

Click to enlarge

YTD Chart


On a 5-year basis the S&P 500(in Green) has outperformed both Brazil and India as shown in the chart below. Brazil(in Blue) has lagged India by a significant margin over the past five years.

5 Yr Chart


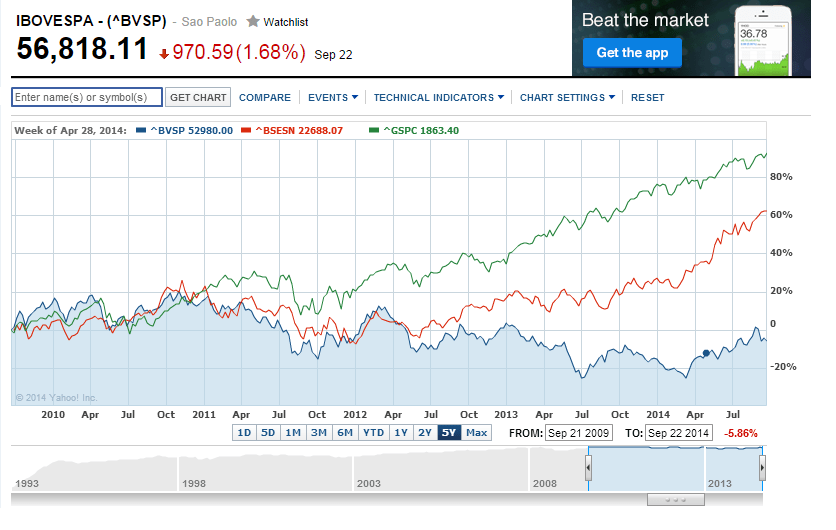
Source: Yahoo Finance

Related ETFs:

  • iShares MSCI Brazil Index (EWZ)
  • iShares S&P India Nifty 50 (INDY)
  • SPDR S&P 500 ETF (SPY)

Disclosure: No Positions

The Lucky Country’s (Australia) Top 5 Exports and Export Markets 2012-13

Australia is commodity-based economy with China being its largest export market. Hence one of the factors that investors in Australian equities need to consider in their analysis is the impact of commodity prices due to the decreased demand from China and other global economies in general.

Australia’s Top 5 Exports in 2012-13:

Click to enlarge

Top Australia Exports


Australia’s Top 5 Export Markets in 2012-13:

 Top Australia Export Markets


Source:Australian Equities: Reasons to be Bullish in 2014?, Jan 2014, Franklin Templeton Investments

Related ETF:

  • iShares MSCI Australia (EWA)

The complete list of Australian ADRs trading on the US markets can be found here.

Disclosure: No Positions

Knowledge is Power: Spain, Emerging Markets, Mighty Ships Edition

Stocks to avoid: The FTSE companies in “terminal decline” (FE Trustnet)

How Big Are Emerging Markets? (Mark Mobius)

Spain is on the road to recovery, but challenges remain to ensure sustainable, inclusive growth, says OECD (OECD)

Three Things to Know About Gold ETFs (Canadian Investment Review)

 How to jumpstart the Eurozone economy (Vox)

What’s happened to Sony? (News Limited)

Are You Really Diversified? (Charles Schwab)

Economic growth: Two-speed Latin America (Euromoney)

Why you may need more international stock (Fidelity)

Mighty Ships (@ Wikipedia)

Palin’s Travels (Site of Traveler and Author Michael Palin)

10 things you should know before going to a German restaurant (Deutsche Welle)

Punta Cana, Dominican Republic

Punta Cana Beach, Dominican Republic

Chart Review: Canada ETF vs. Australia ETF

The Canadian economy is highly dependent on the U.S. economy.It is often said that if U.S. sneezes Canada catches cold. However Australia’s economy is not highly tied to the U.S. economy. Australia is dependent on China. Australia is the major exporter of natural resources such as coal, iron ore to China. As the Chinese economy has cooled in the past few years Australia has been adversely impacted.

In terms of the iShares country ETF for Canada and Australia, the Canadian ETF has outperformed the Australian in the short-term including year-to-date and five years. It is surprising that even over the 10-year period the Canadian ETF beat the Australian as shown in the chart below.

a) iShares Canada vs. Australia ETF performance – year-to-date:

Click to enlarge

EWC vs. EWA - YTD

b) iShares Canada vs. Australia ETF performance – 5 years:

EWC vs. EWA - 5 years

c) iShares Canada vs. Australia ETF performance – 10 years:

EWC vs. EWA - 10 years

Source: Google Finance

Related ETFs:

  • iShares MSCI Canada ETF (EWC)
    iShares MSCI Australia ETF (EWA)

Disclosure: No Positions

The Top 16 Global Consumer Goods Companies by Market Capitalization

CoffeeConsumer goods stocks are attractive from a long-term investment perspective because they are generally less volatile and tend to have slow but steady growth over many years.While they may not offer the thrill of holding hot technology stocks like Facebook(FB) or Apple (APPL) they offer diversification benefits to a portfolio and most importantly they provide downward protection in a bear market. Boring stocks of companies that produce basic things like food, coffee, soft drinks, etc. also offer decent dividends and dividend growth. Hence these types of stocks are suitable not for young investors but also for senior citizens who may be looking for income and some growth.

The following are the Top 15 Consumer Goods Companies from the Global Top 100 Companies by Market Capitalization report published by PricewaterhouseCoopers earlier this year. Investors looking to add stocks in the consumer goods sector can consider this list as a starting point for further research.

1.Company: Nestle SA (NSRGY)
Current Dividend Yield: 3.23%
Sector: Food Products
Country: Switzerland

2.Company:Procter & Gamble Co (PG)
Current Dividend Yield: 3.06%
Sector: Household Products
Country: USA

3.Company: Samsung Electronics Co Ltd
Sector: Electronics
Country: South Korea

4.Company: Toyota Motor Corp (TM)
Current Dividend Yield: 2.75%
Sector: Autos
Country: Japan

5.Company: Anheuser-Busch InBev SA/NV (BUD)
Current Dividend Yield: 1.76%
Sector:Beverages
Country: Belgium

6.Company: The Coca-Cola Co (KO)
Current Dividend Yield: 2.94%
Sector:Beverages
Country: USA

7.Company:Philip Morris International Inc (PM)
Current Dividend Yield: 4.76%
Sector: Household Products
Country: USA

8.Company: PepsiCo Inc (PEP)
Current Dividend Yield: 2.88%
Sector:Beverages
Country: USA

9.Company: Unilever NV (UN)
Current Dividend Yield: 3.11%
Sector: Food Products
Country: The Netherlands

10.Company:Volkswagen AG (VLKAY)
Current Dividend Yield: 2.46%
Sector: Autos
Country: Germany

11.Company: Ambev SA(ABEV)
Sector: Beverages
Current Dividend Yield: 4.30%
Country: Brazil

12.Company: British American Tobacco PLC (BTI)
Current Dividend Yield: 4.16%
Sector:Tobacco
Country: UK

13.Company: L’Oreal SA (LRLCY)
Current Dividend Yield: 2.15%
Sector: Personal Products
Country: France

14.Company:Daimler AG (DDAIF)
Current Dividend Yield: 3.83%
Sector: Autos
Country: Germany

15.Company: LVMH SA (LVMUY)
Current Dividend Yield: 2.45%
Sector: Luxury Goods
Country: France

16.Company:Inditex S.A. (IDEXY)
Current Dividend Yield: 2.15%
Sector: Speciality Retail
Country: Spain

Note: Dividend yields noted above are as of Sept 18, 2014. Data is known to be accurate from sources used.Please use your own due diligence before making any investment decisions.

Disclosure: No Positions