Things To Do In North Wales

One of the best tourist destinations to visit in the UK is North Wales. There are plenty of things to do and see in beautiful Wales including train rides through wonderful mountains, castles, parks, camping, etc. Here are some photos from a few of those tourist places:

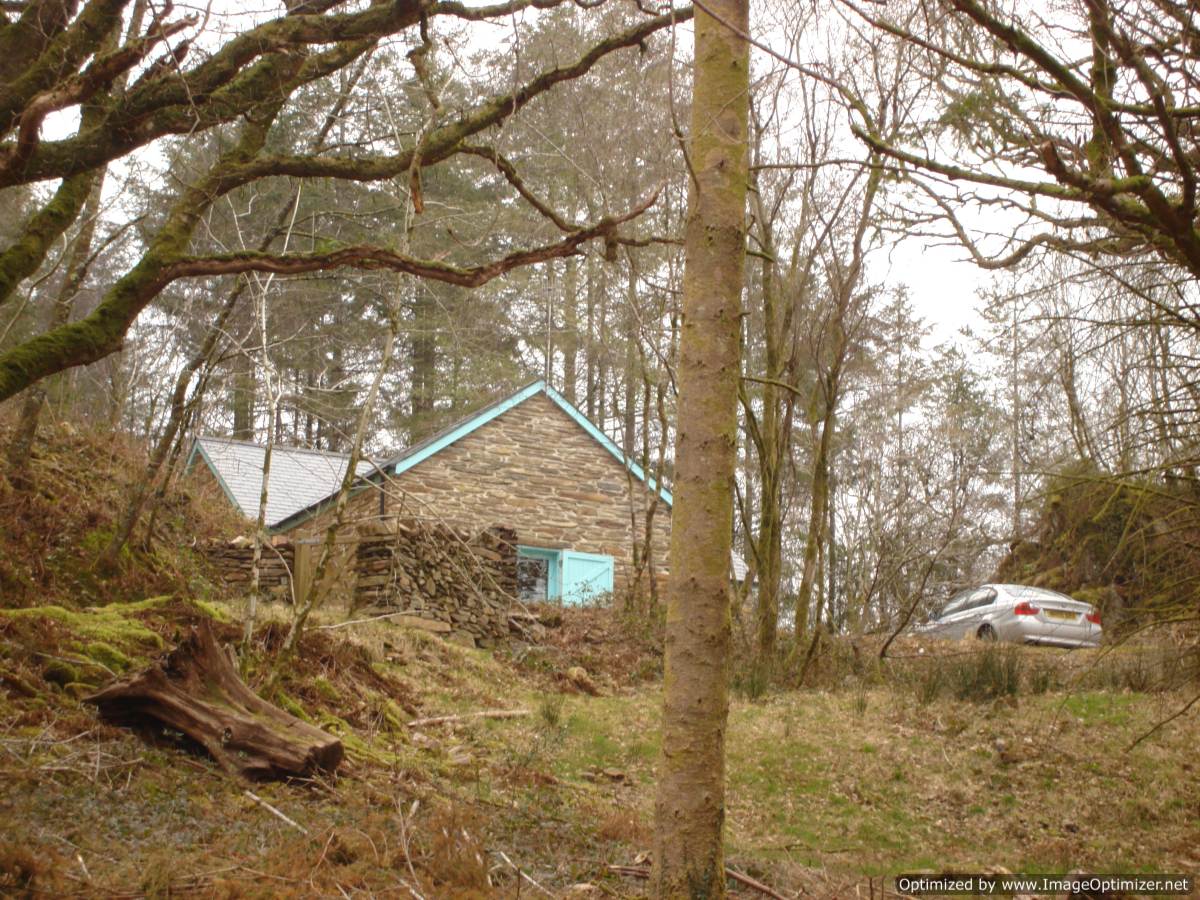
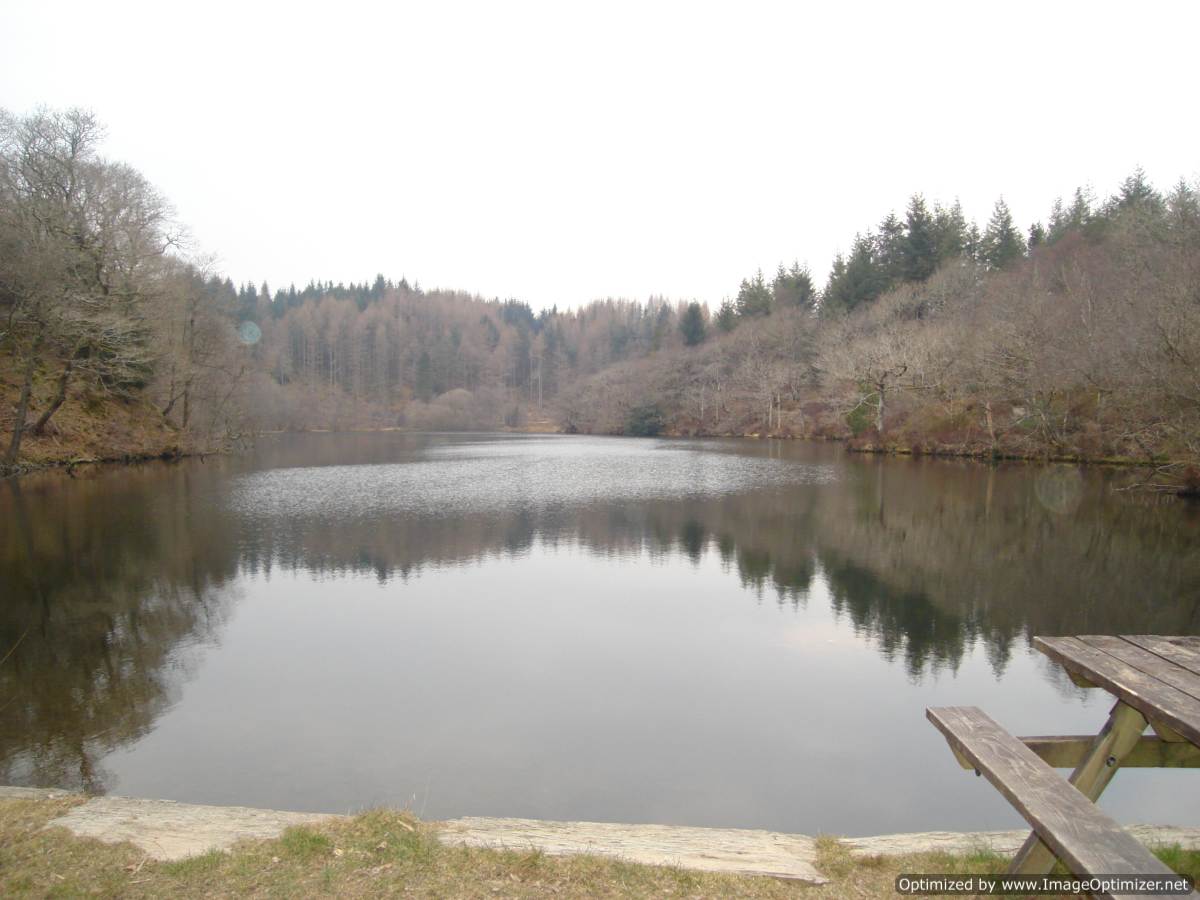
1. Cabin stay in the woods near Tan-y-Bwlch train station:

Click to enlarge

2. Train ride from Tan-y-Bwlch to  Blaenau Ffestiniog and back:

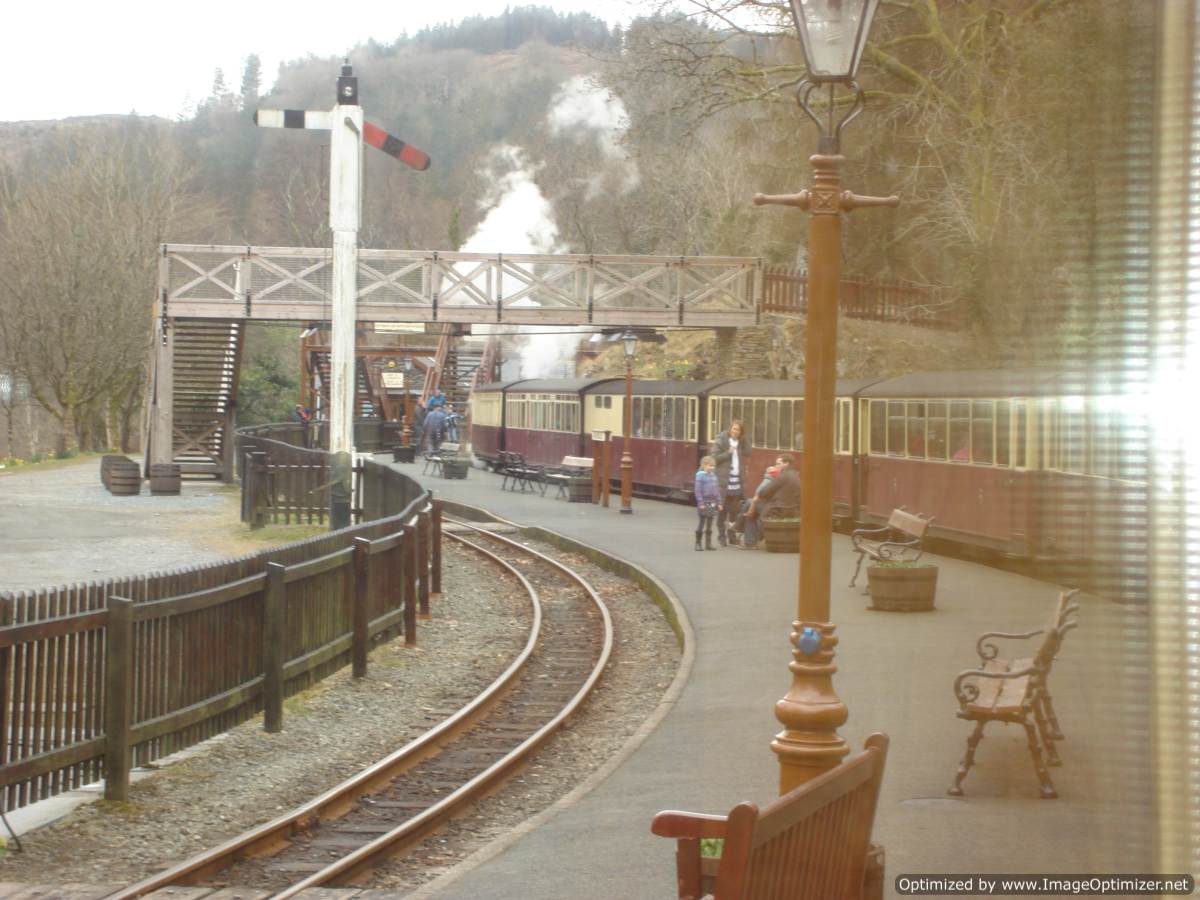
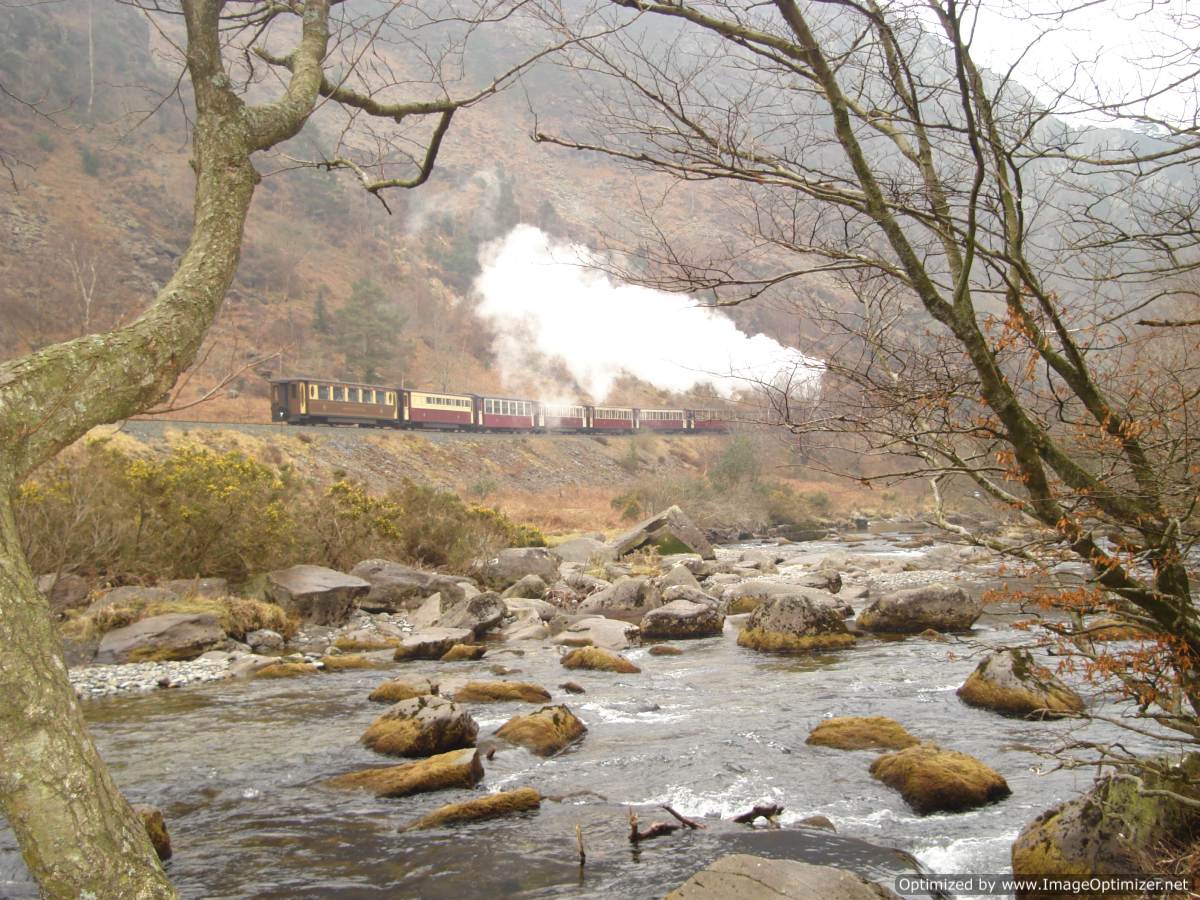
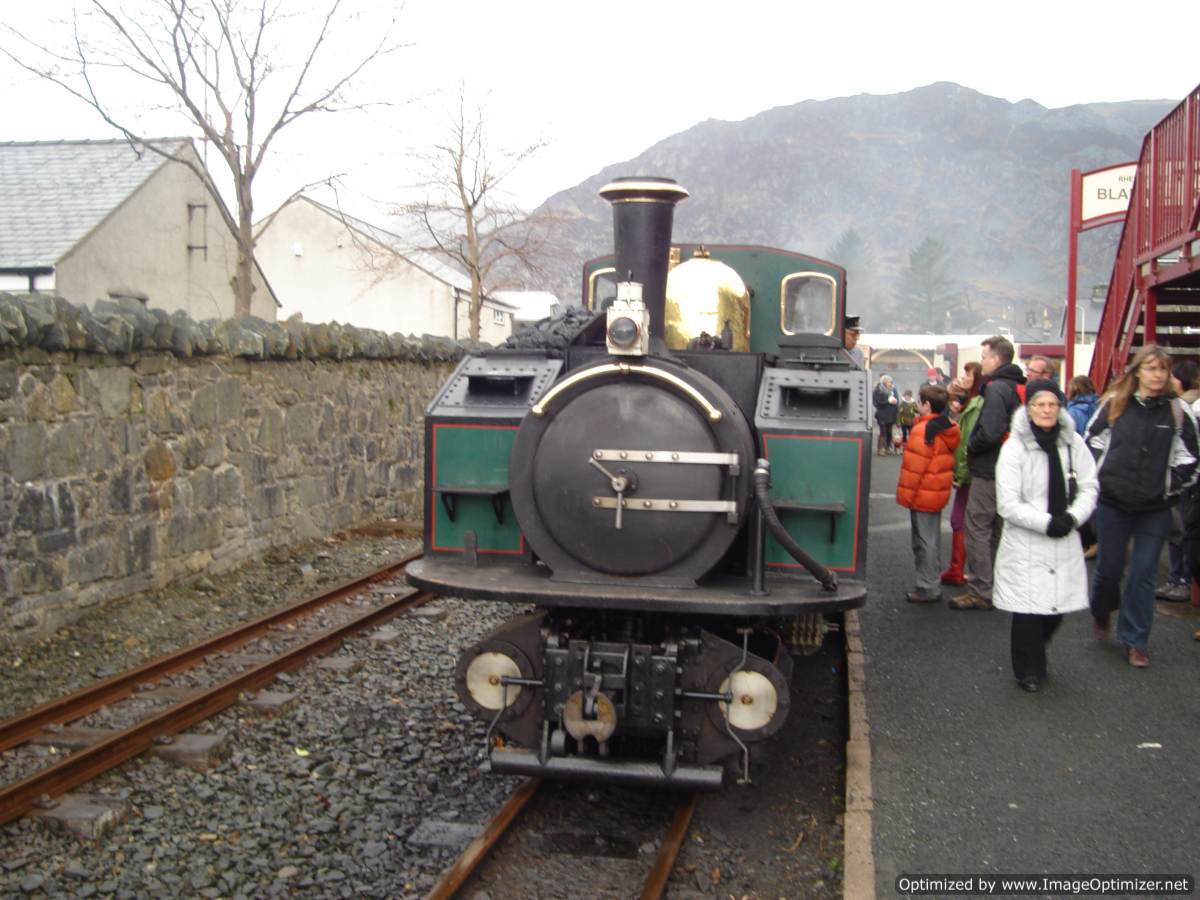
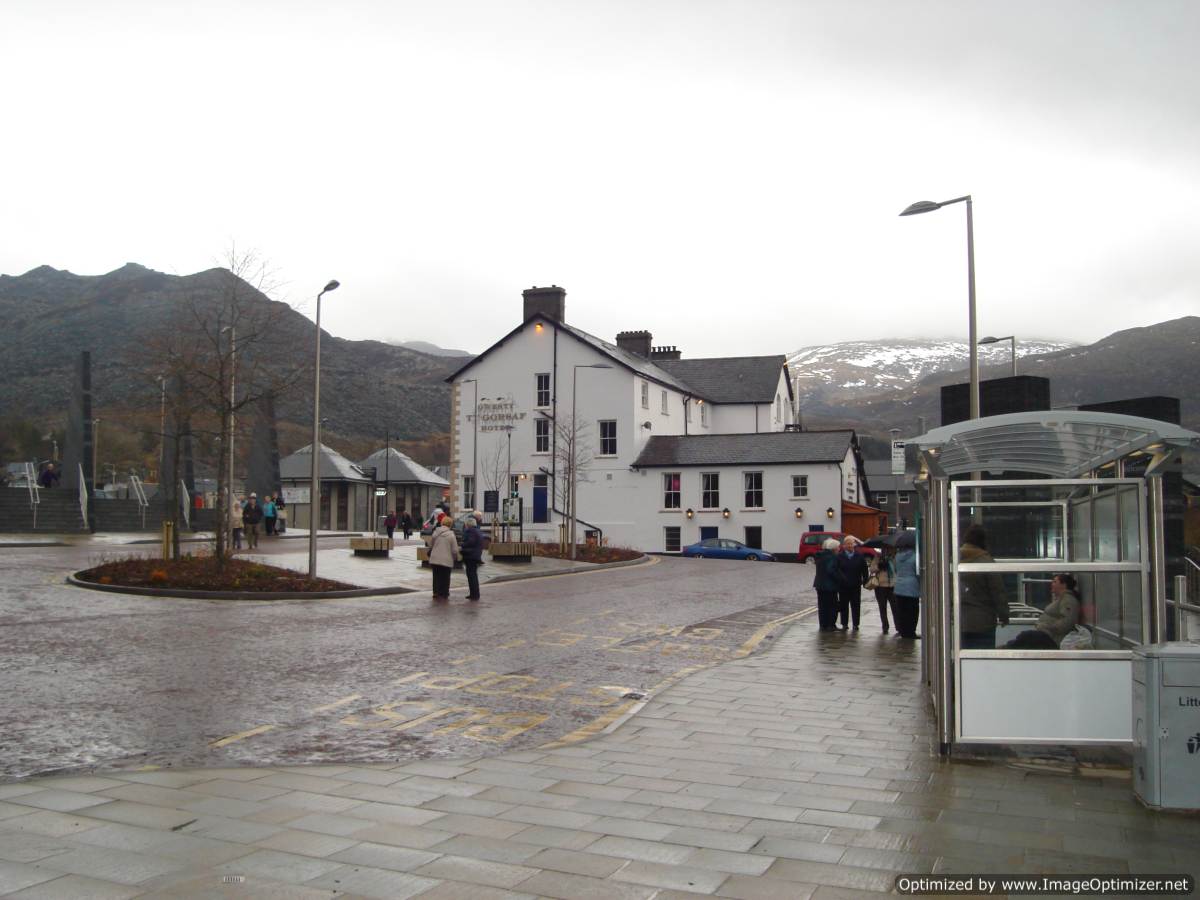
For more info visit: Ffestiniog & Welsh Highland Railways

3.Visit to UNESCO-ranked Caernarfon Castle, in Gwynedd, North Wales

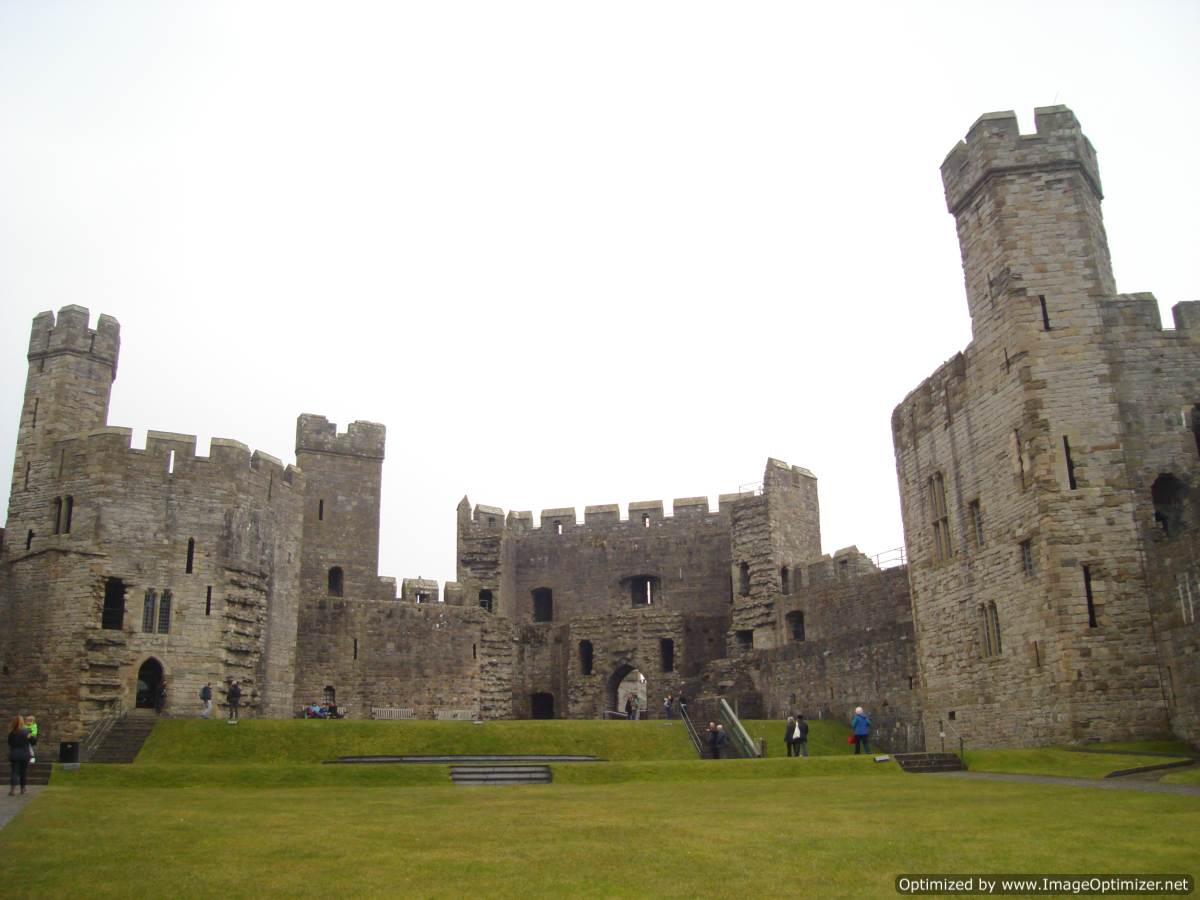
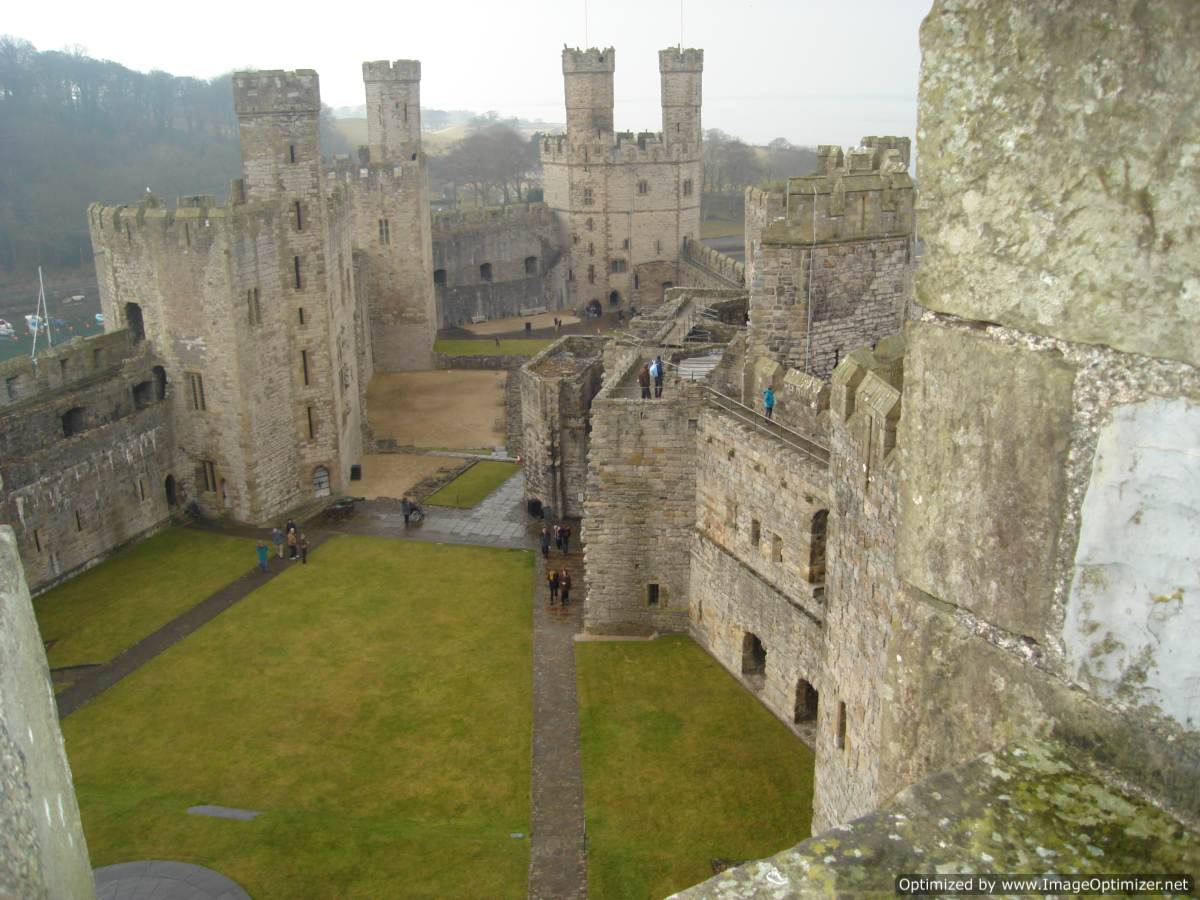
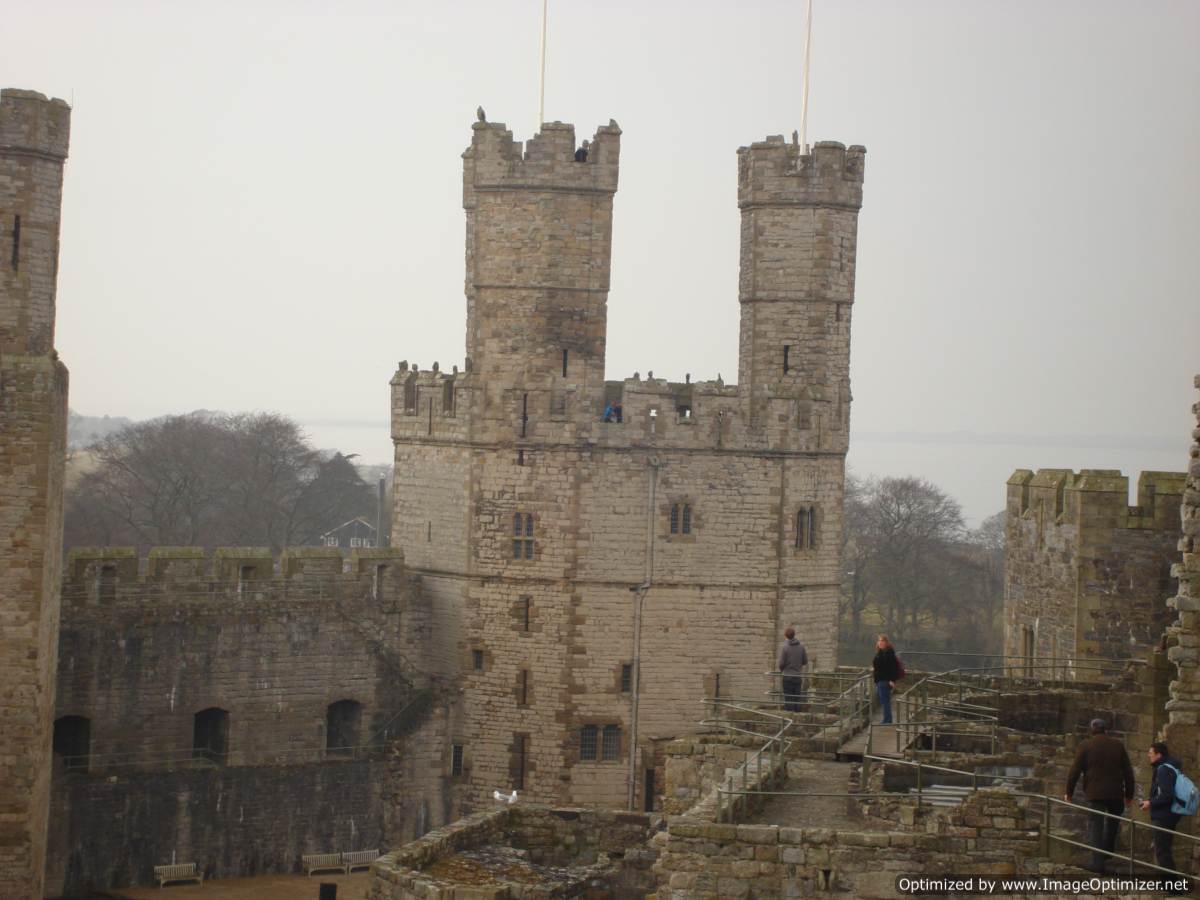
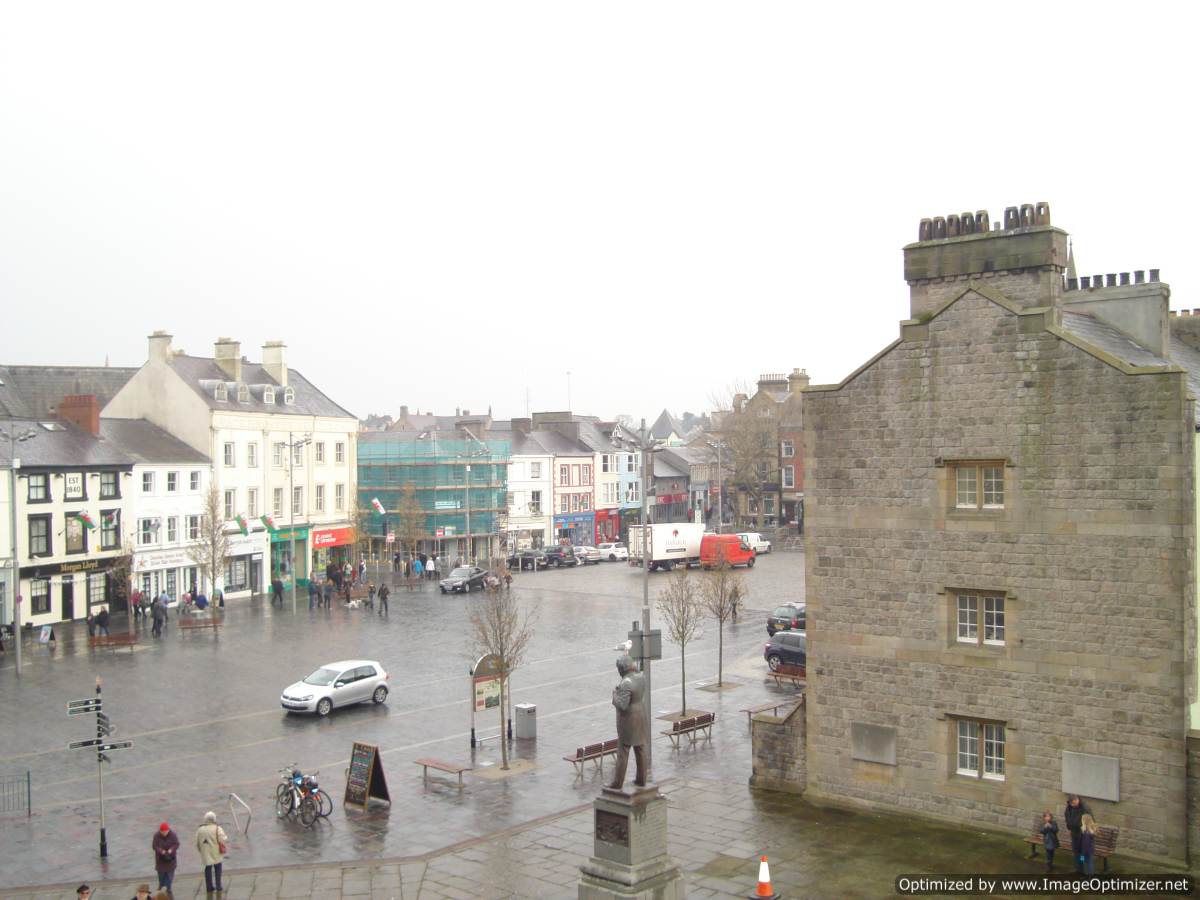
For more info visit: Caernarfon Castle

4. Explore the Awesome Beach Resort town of Llandudno

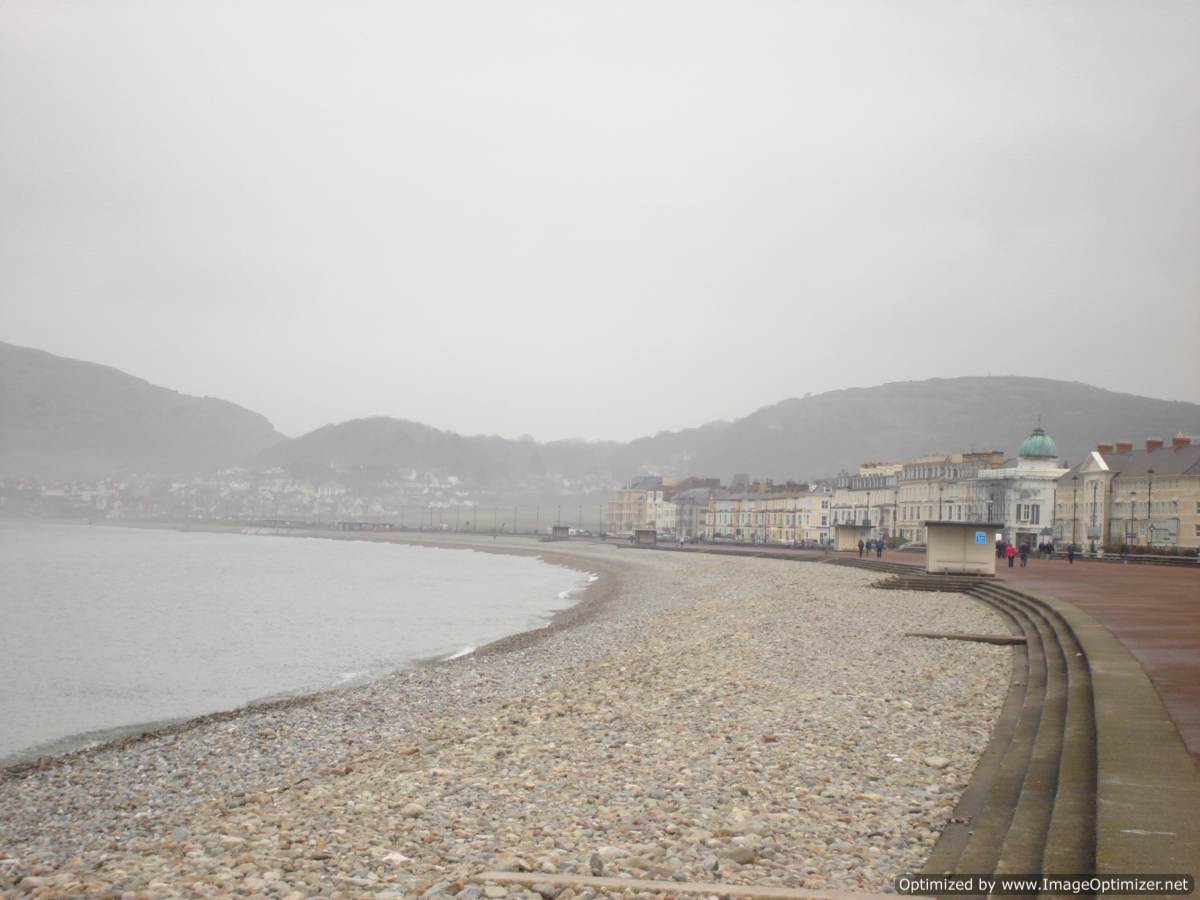
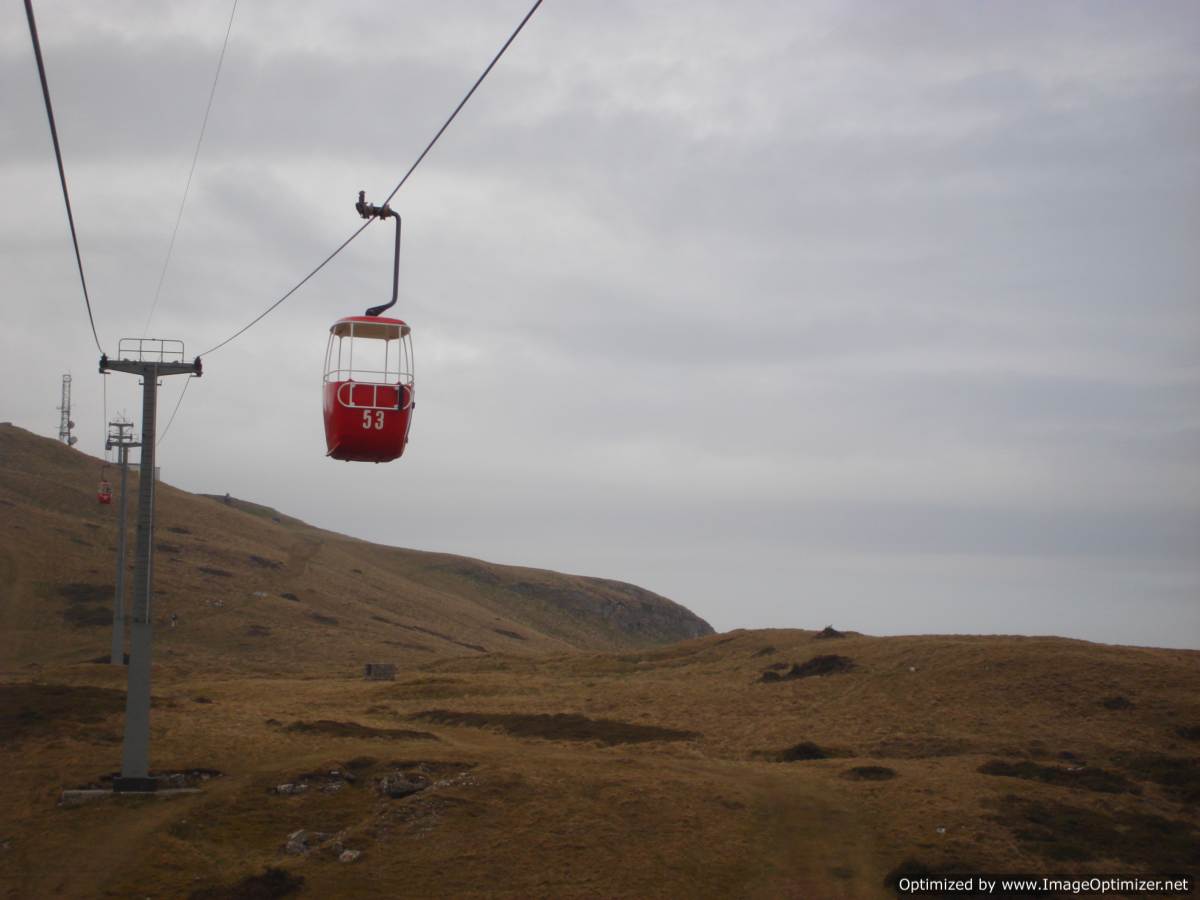
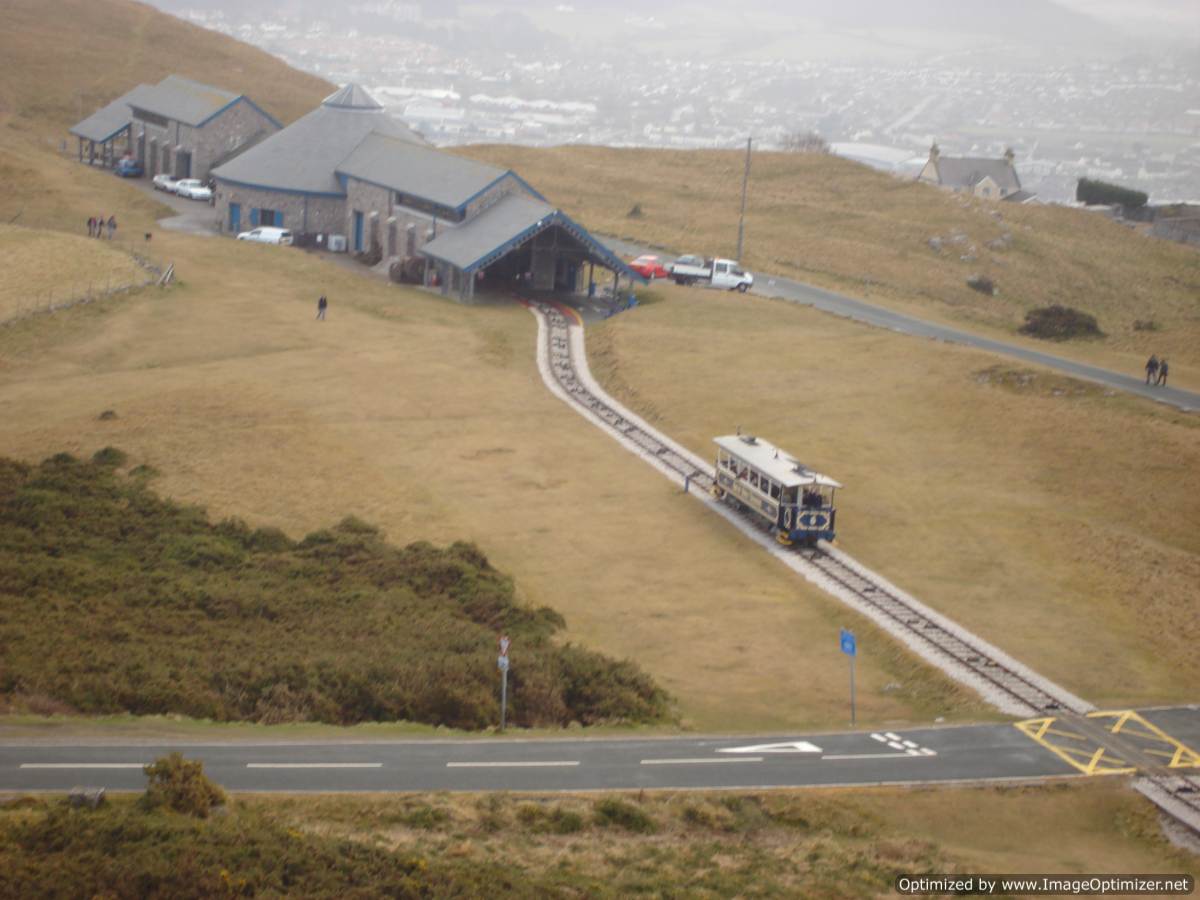
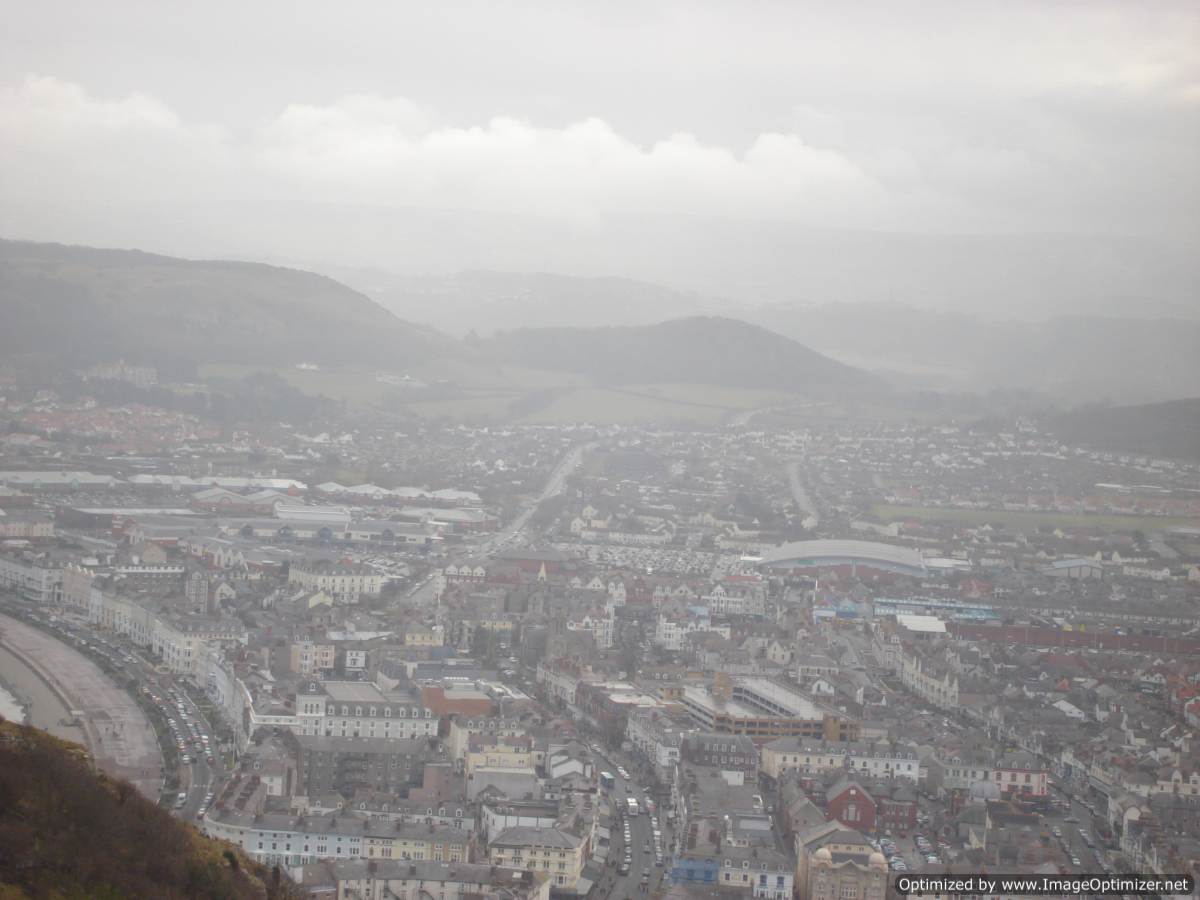
For more info visit: Llandudno Toursim Site

Comparing Financial Asset Class Types Held By U.S, Canadian and European Households

In an earlier post we looked at the financial asset class types held by Latin American households. The following chart shows the various financial assets held by American and Canadian households:

Click to enlarge

Financial Asset Classes of US and Canada Households

The following chart shows the financial assets held by households in Developed Europe:

Financial Asset Classes of European Households

A few observations:

  • Americans hold more of their financial assets in stocks (at 55% in 2013) compared to Canadians.
  • Similarly Canadians hold more bank deposits then Americans.
  • An astonishing 64% of Greek households’ financial assets are in bank deposits while Swedish households have the lowest.
  • In countries such as Swizterland, Ireland, UK, The Netherlands and Denmark the majority of households’ financial assets are in insurance and pensions.

Source: Allianz Global Wealth Report 2014, Allianz

You may also like:


Dividend Withholding Tax Rates By Country 2014

*** UPDATE:  For the latest Dividend Withholding Tax Rates click Dividend Withholding Tax Rates By Country 2016

The withholding taxes for foreign stock dividends vary from country to country. For example, the UK withholding tax on dividends for US investors is 0% while Japan charges 20%.

The following table shows the withholding tax rates for 2014 for some of the countries. For the tax rates of all countries click on the image below to open a pdf document:

Click to enlarge and open a pdf document

Dividend Withholding Taxes By Country Page- 1

Source:  Deloitte

You can also download the pdf by clicking here.

*** UPDATE:  For the latest Dividend Withholding Tax Rates click Dividend Withholding Tax Rates By Country 2016

Quick Post: Mexican Airport Operators Are Flying High

Grupo Aeroportuario del Centro Norte, S.A.B. de C.V. (OMAB) and Grupo Aeroportuario del Sureste, SAB de CV (ASR) operate airports in Mexico. Their stocks have soared in the past five years and are continuing to fly higher. Both the stocks are up by about 200% or more in that period compared to the S&P 500’s less than 100% return as shown in the red line below:

Click to enlarge

Mexico Airport Operators

Source: Yahoo Finance

Grupo Aeroportuario del Centro Norte runs 13 international airports in Monterrey, Acapulco, Mazatlán, Zihuatanejo, Ciudad Juárez, Reynosa, Chihuahua, Culiacán, Durango, San Luis Potosí, Tampico, Torreón, and Zacatecas. Grupo Aeroportuario del Sureste on the other hand operates 9 airports in  the cities of Cancún, Cozumel, Huatulco, Mérida, Minatitlán, Oaxaca, Tapachula, Veracruz, and Villahermosa.

Mexico’s beaches are a major tourist attraction not only to North Americans but also to Europeans and others. For North Americans Mexico offers cheap tourist destinations compared to other places. Hence OMAB and ASUR are benefiting tremendously from the growth of the tourism industry. As noted above they operate the airports in popular destinations like Cancún, Cozumel, Mazatlán, etc.

Disclosure: No Positions

On The Impact of Inflation on Equity Returns

“The way to crush the bourgeoisie is to grind them between the millstones of taxation and inflation.”

– Vladimir Lenin

The S&P 500 closed at 1,977 yesterday. The index has more than doubled from the lows reached in March 2009 at the peak of the global financial crisis. For the first time it crossed the 2,000 mark in August and earlier this month reached a new record of 2,019. According to an article in UK-based MoneyWeek magazine S&P 500 has hit over 30 new record highs this year.

These records may seem fantastic at face value. However when inflation is taken into consideration and the S&P 500’s returns are reviewed in terms of real returns, the soaring index values does not mean much. In fact, quoting Gene Epstein of Barron’s the article notes that the S&P 500 is actually 5% below the previous inflation-adjusted, all-time high reached in March 2000.

Click to enlarge

Real Returns of S&P 500, Down and NASDAQ from 2000 Peak

Source: Chart of the week: Rain falls on the bulls’ parade, MoneyWeek, 9/26/14

From the article:

The S&P 500 previously hit an inflation-adjusted, all-time high in March 2000. Since then, US inflation, as measured by the Consumer Price Index (CPI), has climbed by almost 40%. Factoring that in transforms the previous record to 2,124, notes Epstein, and the market is still more than 5% below this milestone.

Meanwhile, the technology-heavy Nasdaq Composite has done far worse in real terms since 2000; investors in the Dow Jones index, on the other hand, have managed to make a small profit.

So for example an investor holding equities in the form an index fund mirroring the S&P 500 from March 2000 has had a negative return when inflation is included. However in general most investors do not pay much attention to analyze their returns accounting for adverse effects of inflation. The above chart brutally makes it clear that despite being the market for 15 years the investor did not even make a positive real return.

According to one estimate, the value of the US dollar has fallen by 38.1% since 2000. Hence an item that cost $100 in 2000 would cost $138.13 today. To put it another way, the government has destroyed the purchasing power of the dollar by an astonishing 38% during this short-term time period.  Over decades the dollar has lost most its value. The following chart shows the decline in purchasing power of the dollar from 1900 thru 2010:

Purchasing Power of US Dollar since 1900

Source: The Decrease in Purchasing Power of the U.S. Dollar Since 1900,  April 21, 2011, Observations Blog

Related ETFs:

  • SPDR S&P 500 ETF (SPY)
  • SPDR Gold Trust ETF (GLD)
  • PowerShares QQQ Trust (QQQQ)
  • SPDR Dow Jones Industrial Average ETF (DIA)

Disclosure: No Positions