Equity markets in some developed Europe have performed very well so far this year compared to the U.S. market. Stocks in a few of the hard-hit economies of the recent past have rebounded sharply. For example, the year-to-date price returns of the MSCI index for Ireland, Italy, Portugal are 11.1%, 10.95% and 7.44% respectively. The MSCI index for Spain is up by just over 6% YTD. Compared to these returns, the MSCI USA index is basically flat YTD. Most of the other developed European MSCI indices have also performed relatively better than the U.S. Despite the overall better performance, developed Europe stocks have still more room to grow in order to catch-up with their U.S. peers. An article in The Wall Street Journal late last month discussed the reasons on why developed European stocks may finally catch-up with U.S. stocks.
From the article:
European indexes’ heavy weighting in beaten-down banks and the U.S.’s concentration in highflying tech stocks has led to markets whose values contrast sharply, according to one key measure. The 10-year cyclically adjusted price/earnings ratio for U.S. equities is currently around 25 times, compared with 16 times for those in the euro zone, according to Mr. Higgins. In December 2006, just ahead of the financial crisis, both were at around 27 times.
But with European banks’ balance sheets on their way to being cleaned up and U.S. techs looking expensive by some measures, the different sector weightings tilt the odds for gains back toward Europe, BSC’s Mr. Shing says.
At the same time, the European economy is looking more competitive.
Europeans “are now willing to take jobs at less than they were willing to work for three or four years ago, in some cases 30% to 40% less,” said Mr. Browne, pointing to Europe’s high unemployment rates and big drops in wages in some countries.
By contrast, U.S. wages are rising, even after inflation, and a shrinking labor force is putting upward pressure on costs, he added.
Source: Stocks in Europe Look to Even the Score Versus U.S. Counterparts, The Wall Street Journal, March 31, 2014
The following chart shows the 5-year performance of the MSCI Europe and US indices:
Click to enlarge
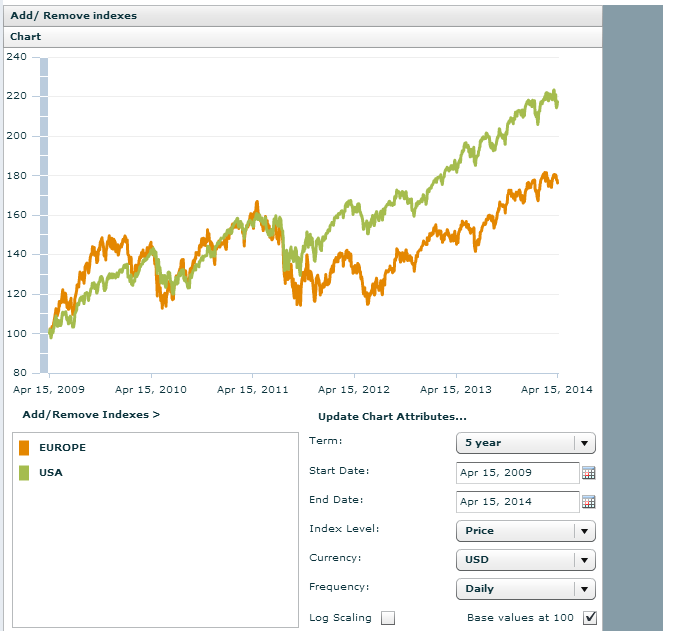
Source: MSCI
One of the key points noted in the journal article is the difference in the MSCI index for developed Europe and the U.S. Financials account for 22.45% in the Europe index compared to just 14.5% for the U.S. index as of March 31, 2014. Due to the high concentration of financials, European markets suffered heavily when financials tanked hard during the past few years as crisis after crisis battered Europe. As European banks have stabilized and are increasingly getting back to normal slowly, the overall equity market should benefit. On the other hand U.S. bank stocks have already had a great run last year and may be range-bound this year.
Similarly the tech sector has a heavy concentration in the MSCI US index with a weighting of 20.5%. The developed Europe index has an allocation of just over 3% for this sector. So when tech stocks soared last year the US index benefited disproportionately relative to the Europe index. The current downtrend in US tech stocks does not bode well for the MSCI index returns.
The dividend yield of the MSCI Europe index is 3.26% and the P/B ratio is 1.82. The corresponding U.S. index values are 2.00% and 2.31%.
Hence investors looking to diversify can add European stocks in a phased manner by taking advantage of the current volatile market conditions. As history has proven many times the same market may not be the top performing market year after after.So US stocks may not outperform their European peers again this year.
The Top Ten Constituents in the MSCI Europe index are listed below with their current dividend yields:
1.Company: Nestle SA (NSRGY)
Current Dividend Yield: 3.18%
Sector: Food Products
Country: Switzerland
2.Company: Roche Holding AG (RHHBY)
Current Dividend Yield: 2.68%
Sector: Healthcare
Country: Switzerland
3.Company: Novartis AG (NVS)
Current Dividend Yield: 2.17%
Sector: Energy
Country: Switzerland
4.Company: Total SA (TOT)
Current Dividend Yield: 5.13%
Sector: Energy
Country: France
5.Company: HSBC Holdings PLC (HBC)
Current Dividend Yield: 4.74%
Sector: Banking
Country: UK
6.Company: GlaxoSmithKline (GSK)
Current Dividend Yield:
Sector: Healthcare
Country: UK
7.Company: Sanofi (SNY)
Current Dividend Yield: 3.12%
Sector: Pharmaceuticals
Country: France
8.Company: Royal Dutch Shell-A(RDS.A)
Current Dividend Yield: 4.17%
Sector: Energy
Country: UK
9.Company: Bayer (BAYRY)
Current Dividend Yield: 2.23%
Sector: Pharmaceuticals
Country: Germany
10.Company: BP PLC (BP)
Current Dividend Yield: 4.67%
Sector: Energy
Country: UK
Note: Dividend yields noted above are as of Apr 15, 2014. Data is known to be accurate from sources used.Please use your own due diligence before making any investment decisions.
Disclosure: No Positions


