The U.S. is the world’s largest economy with a GDP of $16.72 in 2013 based on purchasing power parity according to the the CIA World Factbook. The next largest economies are the EU, China, India and Japan in that order based on 2013 estimates. Compared to the U.S. economy, many of the developed world’s economies are small. For example, the German economy is just $3.2 Trillion in size compared to the $16.0 Trillion U.S. economy.
Since the U.S. economy is so huge, the economies of each of the individual states in the country are also big. In fact, their sizes are comparable to the economies of many countries. Other countries have a lot to catch up in terms of productivity and economic growth.
Click to enlarge
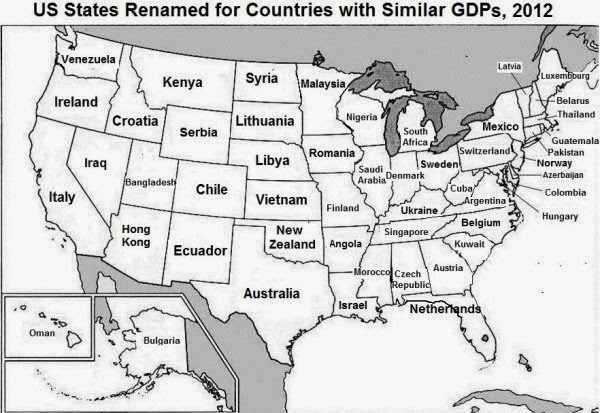
US Map:
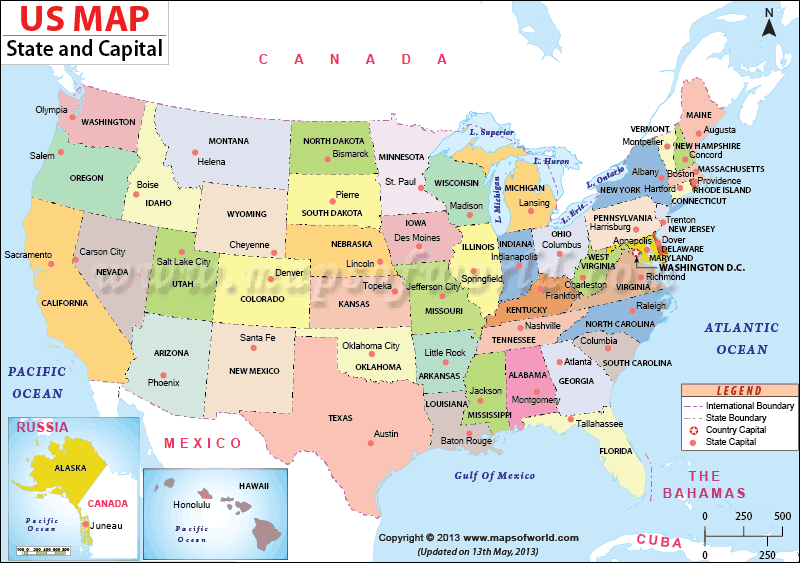
Source: MapsofWorld.com
The following map puts the sizes of the economies of individual US states in perspective. The whole Australian economy is just about the size of the Texas economy.
Source: Unknown