Countries From Which China Imports Energy Resources

As a emerging market superpower China is the largest consumer of many natural resource. China does not have huge crude oil resources and is a net importer of the black stuff.

The following chart shows the list of countries which supply crude oil and natural gas to China:

Click to enlarge

China Energy Import Countries


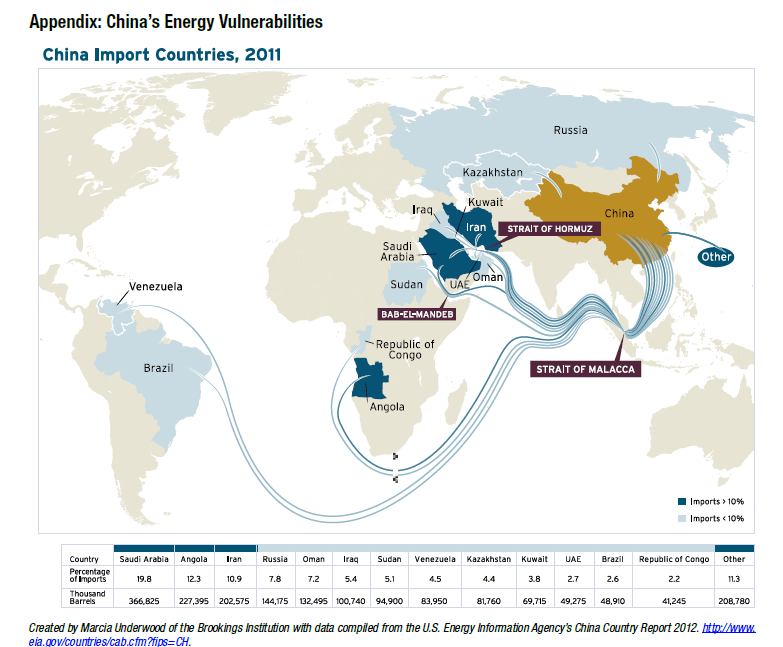
Source: Fueling a New Order? The New Geopolitical and Security Consequences of Energy, April 15, 2014, The Brookings Institution

Saudi Arabia is the largest supplier of oil to China followed by Angola in Africa and Iran. Most of the crude oil and natural gas are shipped by sea to China.In the Western hemisphere Venezuela and Brazil are major source countries for China’s energy imports but not Canada.Since the U.S. and Canadian economies are highly integrated, Canada sends much of its crude oil to the U.S. via pipelines and rail making it the largest trading partner of the U.S. The U.S. does export oil to other countries due to a ban on exports.

The Top 10 Trade Partners of Greece

Greece is on the southern end of Europe and has an archipelago of 2,000 islands. The economy is a medium size economy in Europe with an estimated GDP of $267.0 billion based on Purchasing Power Parity. Greece has democracy as the political system and a free market capitalist economy. One of the major negative factors for Greece is the size of the public sector in the economy.The public sector accounts for about 40% of the GDP.

The Top 10 Export Partners for Greece are shown below:

Click to enlarge

Greece-Top 10 Export Partners

The top three export destinations for Greek products are Turkey, Italy and Germany. The major export products are oil and mineral fuels, aluminium and electrical machinery.

The Top 10 Import Partners for Greece are shown below:

Greece-Top 10 Import Partners

The top three source countries for imported goods are Russia, Germany and Italy.

Note: Data shown are 2012 data from the UN.

Source: Global Edge, Michigan State University

Differences and Similarities Between Major Frontier Market Indices

Frontier markets refer to all markets that are not developed or emerging. These markets include places like Ecuador, Nigeria, Namibia, Iran, etc. The following map shows the countries that are considered as frontier markets by the global investment community:

Click to enlarge

Frontier Markets Map

Source: WSJ Graphics

According to a research report by Ben Garland and Kelvin Dell of Blackrock, index providers classify countries as developed, emerging or frontier  based on three factors: economic development, market size and liquidity and accessibility to international investors. Frontier markets are characterized by the lowest of these factors relative to the developed and emerging equity markets.

The frontier universe is comprised of 40 countries. However the assignment of a market as frontier differs between the index providers as the  table below shows:

Click to enlarge

Frontier markets Index Comparison

Source:  Crossing the Frontier, Blackrock

NOTE: In Septmeber 2014, FTSE downgraded Morocco from “secondary emerging market” to frontier market status and excluded Argentina from the Frontier Markets index.

Among the four index providers the index by MSCI is the most widely used.In May 2014, MSCI upgraded Qatar and UAE to emerging market status. After this reclassification the regional allocation of the index looks like shown below:

MSCI Frontier Markets Index Composition

At a global level frontier markets are tiny in terms of global market capitalization.

Frontier Markets GDP and Market Cap

The main competition to the MSCI index is the index created by FTSE. For example, in 2013 Vanguard switched their benchmark indices from MSCI to FTSE. I wrote an article comparing the key differences between MSCI and FTSE indices at that time.

Below are some of the differences and a few similarities between the MSCI Frontier Markets Index and FTSE Frontier Markets Index:

  1. The MSCI index has 26 countries in the index but FTSE has only 24. Both the indices give big weightage to Nigeria and middle eastern markets.
  2. Despite a high standard of living and a GDP per capita of $48,000 in 2013, Kuwait is assigned the frontier market status by both MSCI and FTSE because of strict foreign ownership limits in Kuwaiti companies and underdeveloped operational infrastructure.
  3. The evolving markets of Vietnam and Bangladesh are both included in the MSCI and FTSE indices.
  4. Natural resources plays a major in many of the frontier markets. For instance, Nigeria is a major oil producer, Argentina is a major food producer, Ukraine producers iron ore, Zambia is a major copper producer and Vietnam is a leading coffee exporter.
  5. With respect to small economies, the FTSE Index includes countries such as Bulgaria, Botswana, Cyprus and Macedonia while the MSCI Index includes Kuwait, Morocco, Lebanon and Ukraine.
  6. The top 10 markets in the FTSE index is dominated by Nigerian and Qatari companies while the top 10 of the MSCI index is concentrated in Nigerian and Kuwaiti firms.
  7. The selection criteria between MSCI and FTSE varies. From an article in The Wall Street Journal: ” The differences between the two company’s country choices are primarily the result of the selection criteria they use. MSCI considers a country’s accessibility for international investors, the liquidity of its market and its economic growth. In FTSE’s case, for a country to be classified as frontier it needs to meet some crucial points: a formal stock market, few restrictions on capital repatriation and low occurrence of failed trades.”

Sources:

FTSE’s New Frontier Indices Take Aim at MSCI Standard, Sept 11, 2014,  The Wall Street Journal

New FTSE Frontier Markets Index is not very good, here is why, Sept 18, 2014, Investment Frontier

Related ETFs:

  • Guggenheim Frontier Markets ETF (FRN)
  • iShares MSCI Frontier 100 ETF (FM)
  • PowerShares MENA Frontier Countries ETF (PMNA)
  • Market Vectors Africa ETF (AFK)

Disclosure: No Positions

On The Relationship Between Economic Growth and Stock Market Returns

One of the myths among investors is that economic growth influences the growth of equity markets.However this is not true. Study after study has confirmed that there is no relationship between economic growth and equity markets growth. This is because stocks can rise for a multitude of reasons which have nothing to do with economic growth.

For example, last year among the BRIC countries, equity markets in China and India were among the best performing markets in the world. But their economic growth were relatively muted compared to their previous years. Despite the average growth, stocks rose relentlessly. Various factors such as P/E expansion, investors’ hopes on economic reforms, political changes, flow of foreign portfolio investments into the equity markets, etc. all played a role in the excellent performance of stocks in those markets.

Nick Mustoe, Chief Investment Officer of Invesco Perpetual wrote in an article that in the 2002 book   ‘Triumph of the Optimists’ by  Elroy Dimson, Paul Marsh and Mike Staunton, London Business School showed there exists no relationship between economic growth and stock market returns. The 2014 edition of Credit Suisse Global Returns Yearbook also confirmed this theory as shown in the chart below:

Click to enlarge

_Rental growth_Chart_aw

Source: Credit Suisse Global Returns Yearbook, February 2014 via Global Equities: a long-term investment strategy, 12 November 2014,  Invesco Perpetual

Some investors may prefer to developed Europe as a result of the poor performance of equity markets last year and ongoing sluggish economic growth. They may be missing out on potential investment opportunities. As shown above, stocks can still rise even if economic growth remains anemic and no market has consistently ranked the best market year after after.

Ten stocks from developed Europe are listed below with their current dividend yields for further research:

1.Company: Nordea Bank AB (NRBAY)
Current Dividend Yield: 5.14%
Sector: Banking
Country: Sweden

2.Company:Air Liquide (AIQUY)
Current Dividend Yield: 2.56%
Sector: Chemicals
Country: France

3.Company: Autoliv Inc (ALV)
Current Dividend Yield: 2.04%
Sector: Auto Parts
Country: Sweden

4.Company:SABMiller PLC (SBMRY)
Current Dividend Yield: 0.99%
Sector:Beverages
Country: UK

5.Company:Enel SpA (ENLAY)
Current Dividend Yield: 3.99%
Sector: Integrated Oil
Country: Italy

6.Company: Technip (TKPPY)
Current Dividend Yield: 4.34%
Sector: Energy Equipment & Services
Country: France

7.Company: UBS AG(UBS)
Current Dividend Yield: 1.65%
Sector: Banking
Country: Switzerland

8.Company: Fresenius Medical Care AG & Co (FMS)
Current Dividend Yield: 1.42%
Sector: Health Care Providers & Services
Country: Germany

9.Company: Edp Energias De Portugal SA (EDPFY)
Current Dividend Yield: 6.49%
Sector:  Electric Utilities
Country: Portugal

10.Company: Siemens AG (SIEGY)
Current Dividend Yield: 3.65%
Sector:Industrial Conglomerates
Country: Germany

Note: Dividend yields noted above are as of Dec 31, 2014. Data is known to be accurate from sources used.Please use your own due diligence before making any investment decisions.

Disclosure: Long TKPPY