The European banking sector offers many attractive opportunities now as the economic recovery gains momentum. Investors looking to buy and hold these stocks for a minimum of three to five years may be able to reap solid returns. Unlike in the past, it is highly unlikely that another European sovereign debt or other type of crisis will occur due to the change of government in Greece.
After years of dithering some banks in Europe have raised capital and are now in a better position than before. They have also written off most of their bad debts and are now focused on growing profitably again.In addition, the financial sector is the pillar of any economy and hence banks are bound to benefit from increased economic activity in Europe. European bank stocks also lagged their American peers last year and offer value at current levels.
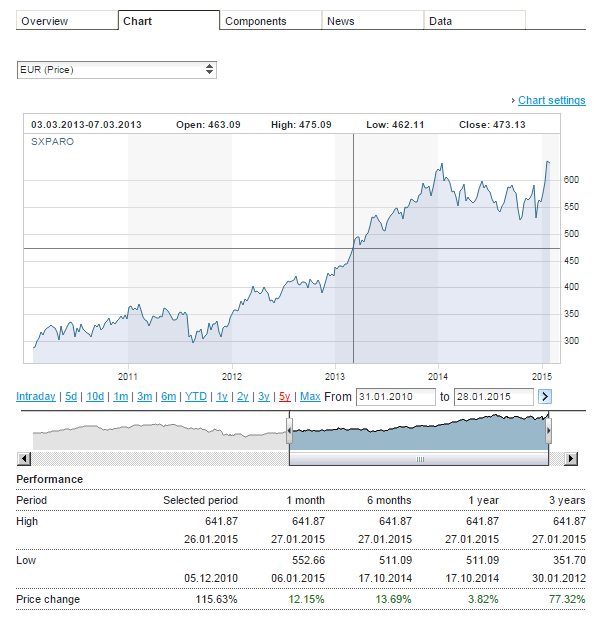
The Euro STOXX Banks Index which contains 32 banks from the Eurozone is down 2.55% year-to-date in Euro price terms. In the past five years the index is down about 35%.
The following are five European bank stocks that investors must avoid:
1.Company: Royal Bank of Scotland Group PLC (RBS)
Current Dividend Yield: No dividends paid
Country: UK
The British government owns 63% of ordinary shares and RBS is still suffering from losses sustained during the global financial crisis.
2.Company: Lloyds Banking Group PLC (LYG)
Current Dividend Yield: No dividends paid
Country: UK
Similar to RBS, the state is a major owner of Lloyds and the bank last paid a dividend in 2009.
3.Company: National Bank of Greece (NBG)
Current Dividend Yield: No dividends paid
Country:Greece
Despite two reverse stock splits in a short period of time, National Bank of Greece is not worth investing now.
4.Company: Danske Bank (DNSKY)
Current Dividend Yield: No dividends paid
Country: Denmark
Though Danske restarted dividend payments last year, it still has a long way to go before becoming “normal” bank.
5. Company:Societe Generale (SCGLY)
Current Dividend Yield:
Country: France
Socgen raised its dividend last year but the stock is still ignored by big investors. The stock price struggles to move past the $10 range. BNP Paribas may be a better alternative among French banks.
Five European bank stocks to consider:
1.Company: ING Groep NV (ING)
Current Dividend Yield: No dividends paid
Country: The Netherlands
ING paid off its final EUR 1.025 billion loan to the Dutch government in November, 2014 and is on track to restart its dividend payments this year. The bank hasn’t paid a dividend since the global financial crisis. ING sold off many of its units worldwide in recent years including the ING Direct units in Canada and U.S. to raise cash. At $12.72 a share one cannot go wrong to buy it for the long haul.
2.Company: Nordea Bank AB (NRBAY)
Current Dividend Yield: 4.75%
Country: Sweden
On Jan 28th, Nordea raised dividends by 44% and will now 0.62 euro per share from 0.43 euro earlier. The ADR swiftly rose in two days from $11.83 to close at $12.96 today.
3.Company:Svenska Handelsbanken AB (SVNLY)
Current Dividend Yield: 5.41%
Country: Sweden
One of the strongest and most conservative banks in the world. The bank has good growth prospects according to this article.
4.Company: UBS AG (UBS)
Current Dividend Yield: 1.70%
Country: Switzerland
5.Company: HSBC Holdings PLC (HSBC)
Current Dividend Yield: 5.27%
Country: UK
Of all the major British banks, “The World’s Local Bank” looks attractive at current levels with an excellent dividend yield.
Note: Dividend yields noted above are as of Jan 29, 2015. Data is known to be accurate from sources used.Please use your own due diligence before making any investment decisions.
Disclosure: Long ING, DNSKY, LYG