The Panama Canal is 48 miles long connecting the Atlantic and the Pacific oceans. The canal opened in 2014. I came across the following cool infographic at Allianz:
Click to enlarge
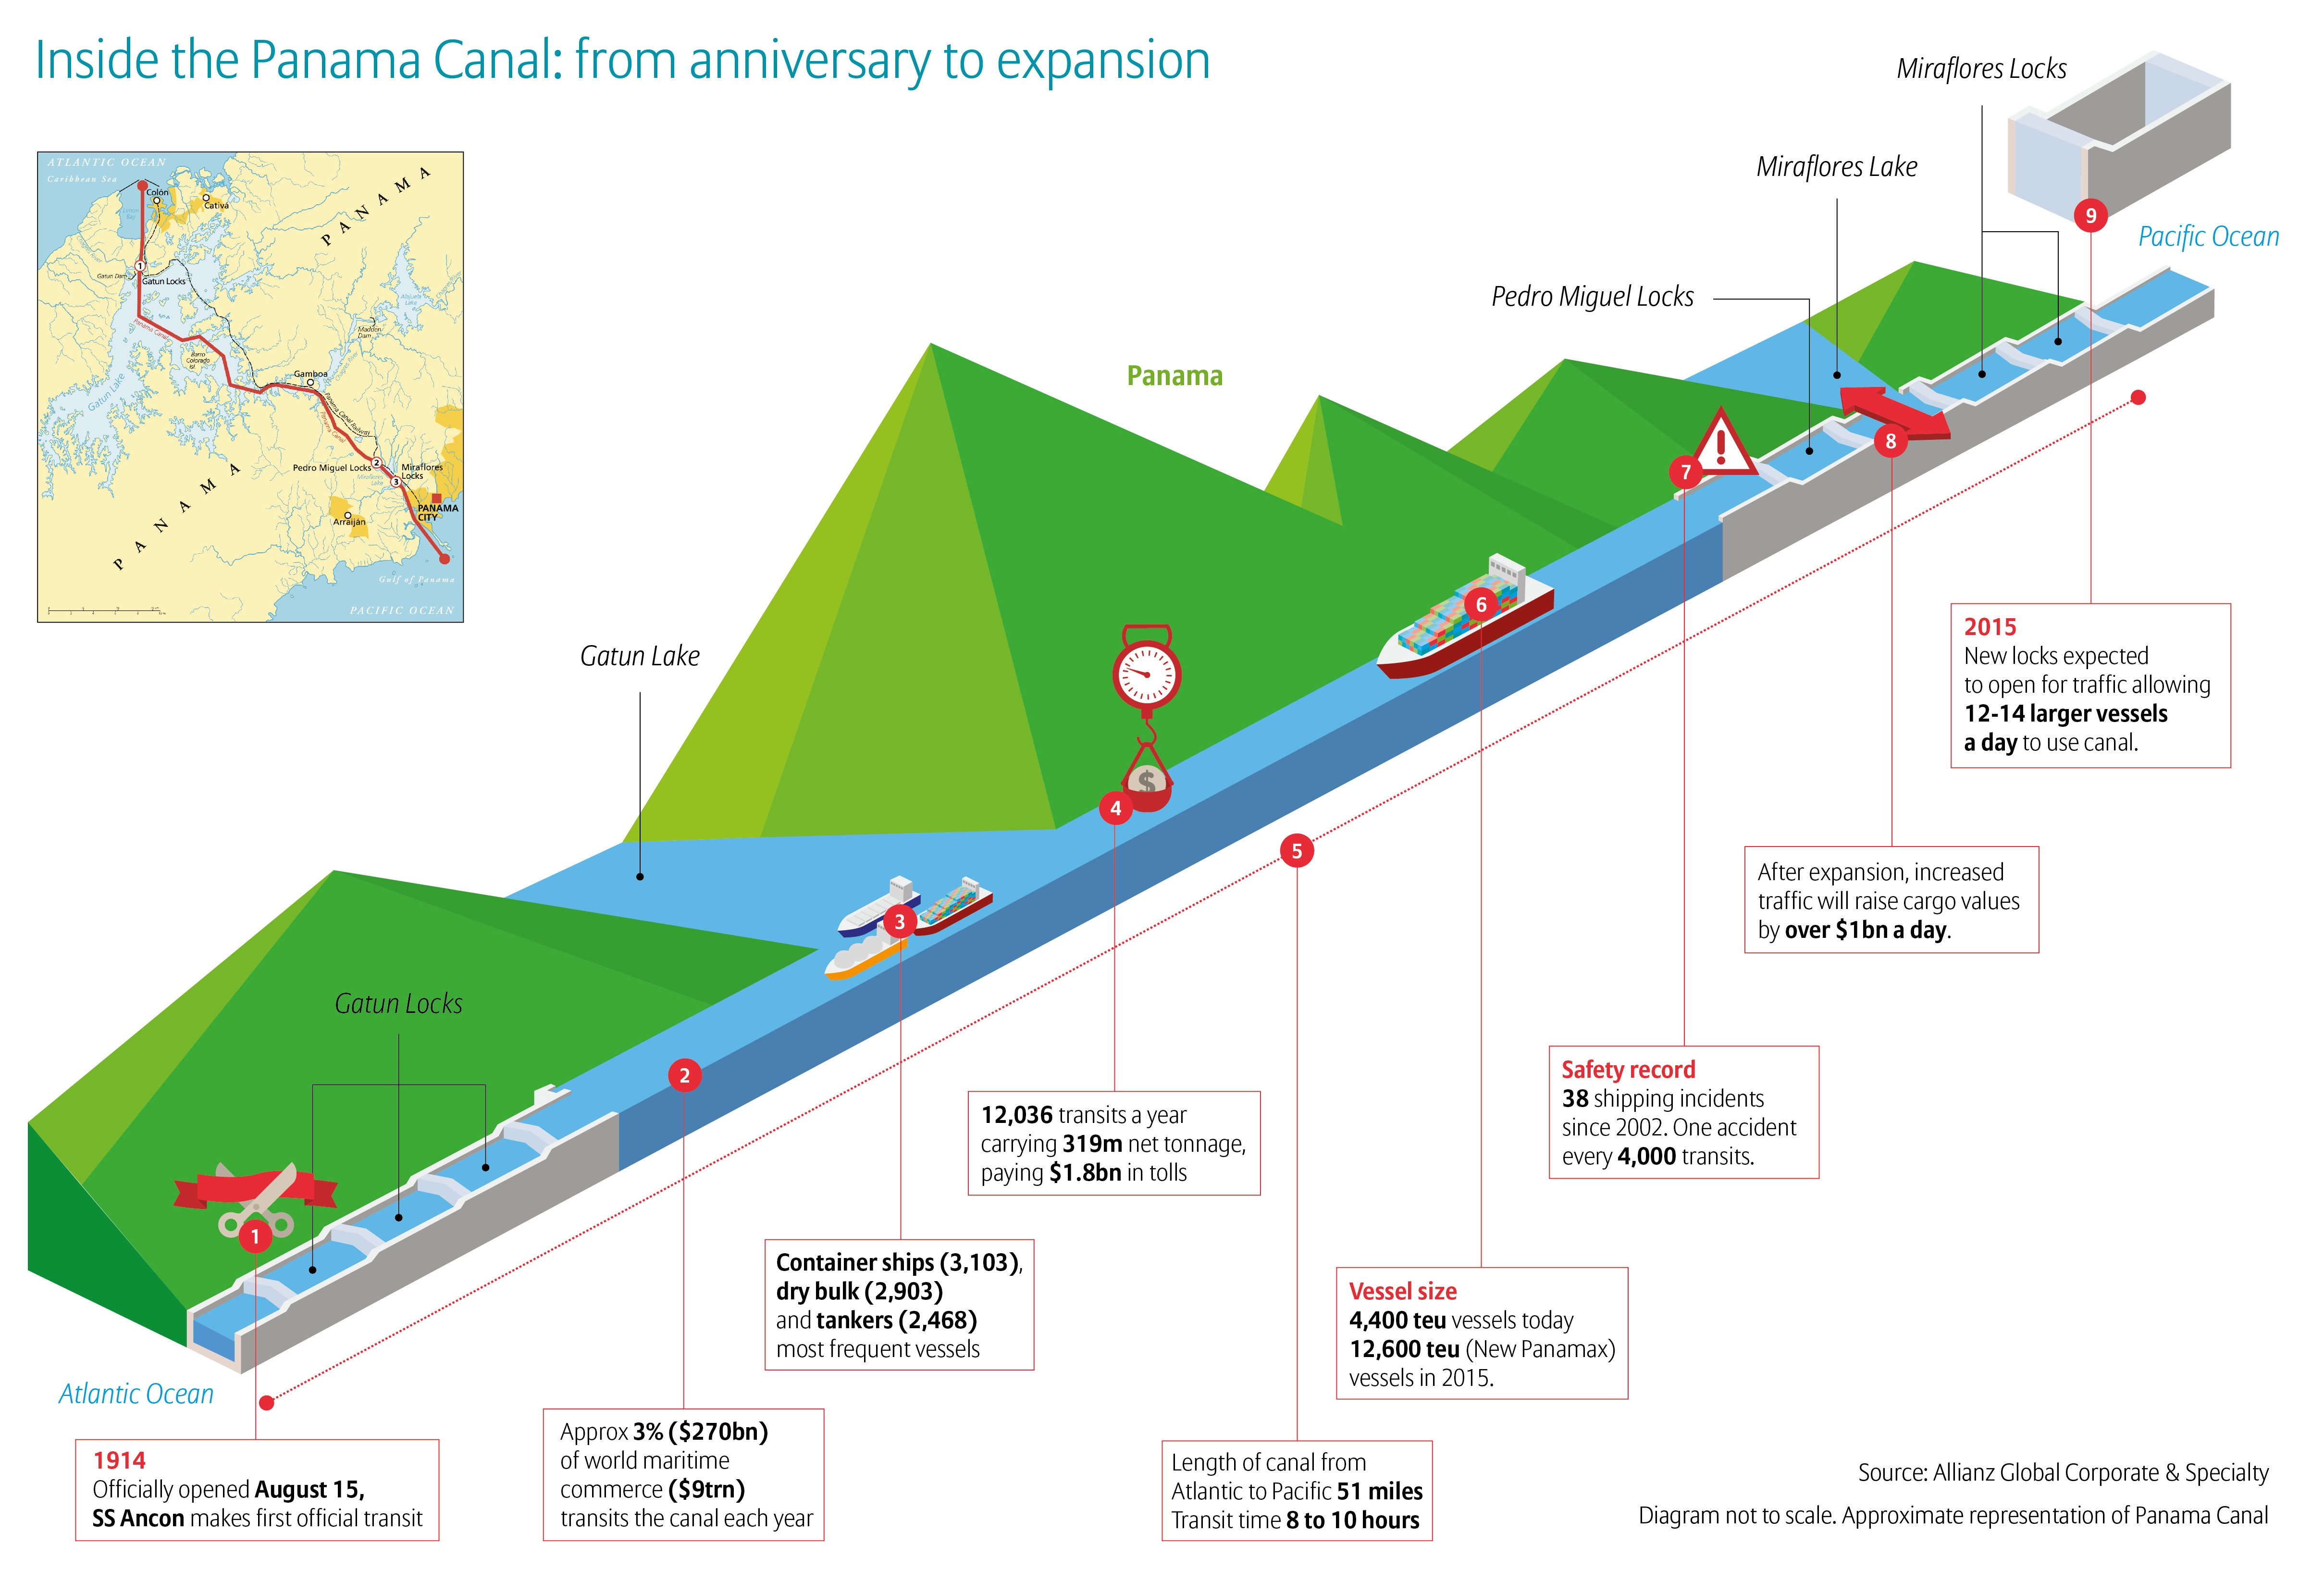
Source: Allianz
The Panama Canal is 48 miles long connecting the Atlantic and the Pacific oceans. The canal opened in 2014. I came across the following cool infographic at Allianz:
Click to enlarge
Source: Allianz
In October of last year the European Banking Authority published the results of its stress test results of European banks. Most of the banks studied by the agency passed the test with only 13 identified to need extra capital including Banca Monte dei Paschi di Siena SpA of Italy, National Bank of Greece(NBG). From a Journal article in October:
The European Central Bank and the European Banking Authority announced the results of a nearly yearlong effort to assess the finances of 150 banks, identifying 13 that still need to come up with a total of €9.5 billion ($12 billion) in extra capital.
Overall, 25 banks technically failed the so-called stress tests, facing a cumulative shortfall of €24.6 billion. But most have already taken steps to solve their problems since the end of 2013, the cutoff date for the exercise.
To pass the tests, banks had to show that they had ample capital to survive a crisis that would cause Europe’s economy to fall 7% below current forecasts and the unemployment rate to rise to 13%.
Source: ECB Says Most Banks Are Healthy, Oct 27, 2014, WSJ
The U.S. Federal Reserve published its first stress test results of major banks this past Thursday. Overall the results were positive with all the banks studied having enough capital to survive a crisis. From a Journal article:
The overall results Thursday buttress regulators’ view that the financial system is safer than before the recent recession, in large part because of loss-absorbing capital built up ahead of the annual test.
The Fed said the 31 banks’ aggregate Tier 1 common capital ratio, which shows high-quality capital as a percentage of risk-weighted assets, dipped as low as 8.2% under the stressful scenario, well above the 5.5% level measured in early 2009 and the 5% level the Fed considers a minimum allowance.
The results could bolster big banks’ push to return more of their income to restless shareholders after years of conservative payouts.
The Tier 1 Common Ratio of Large U.S. Banks is shown below:
Click to enlarge
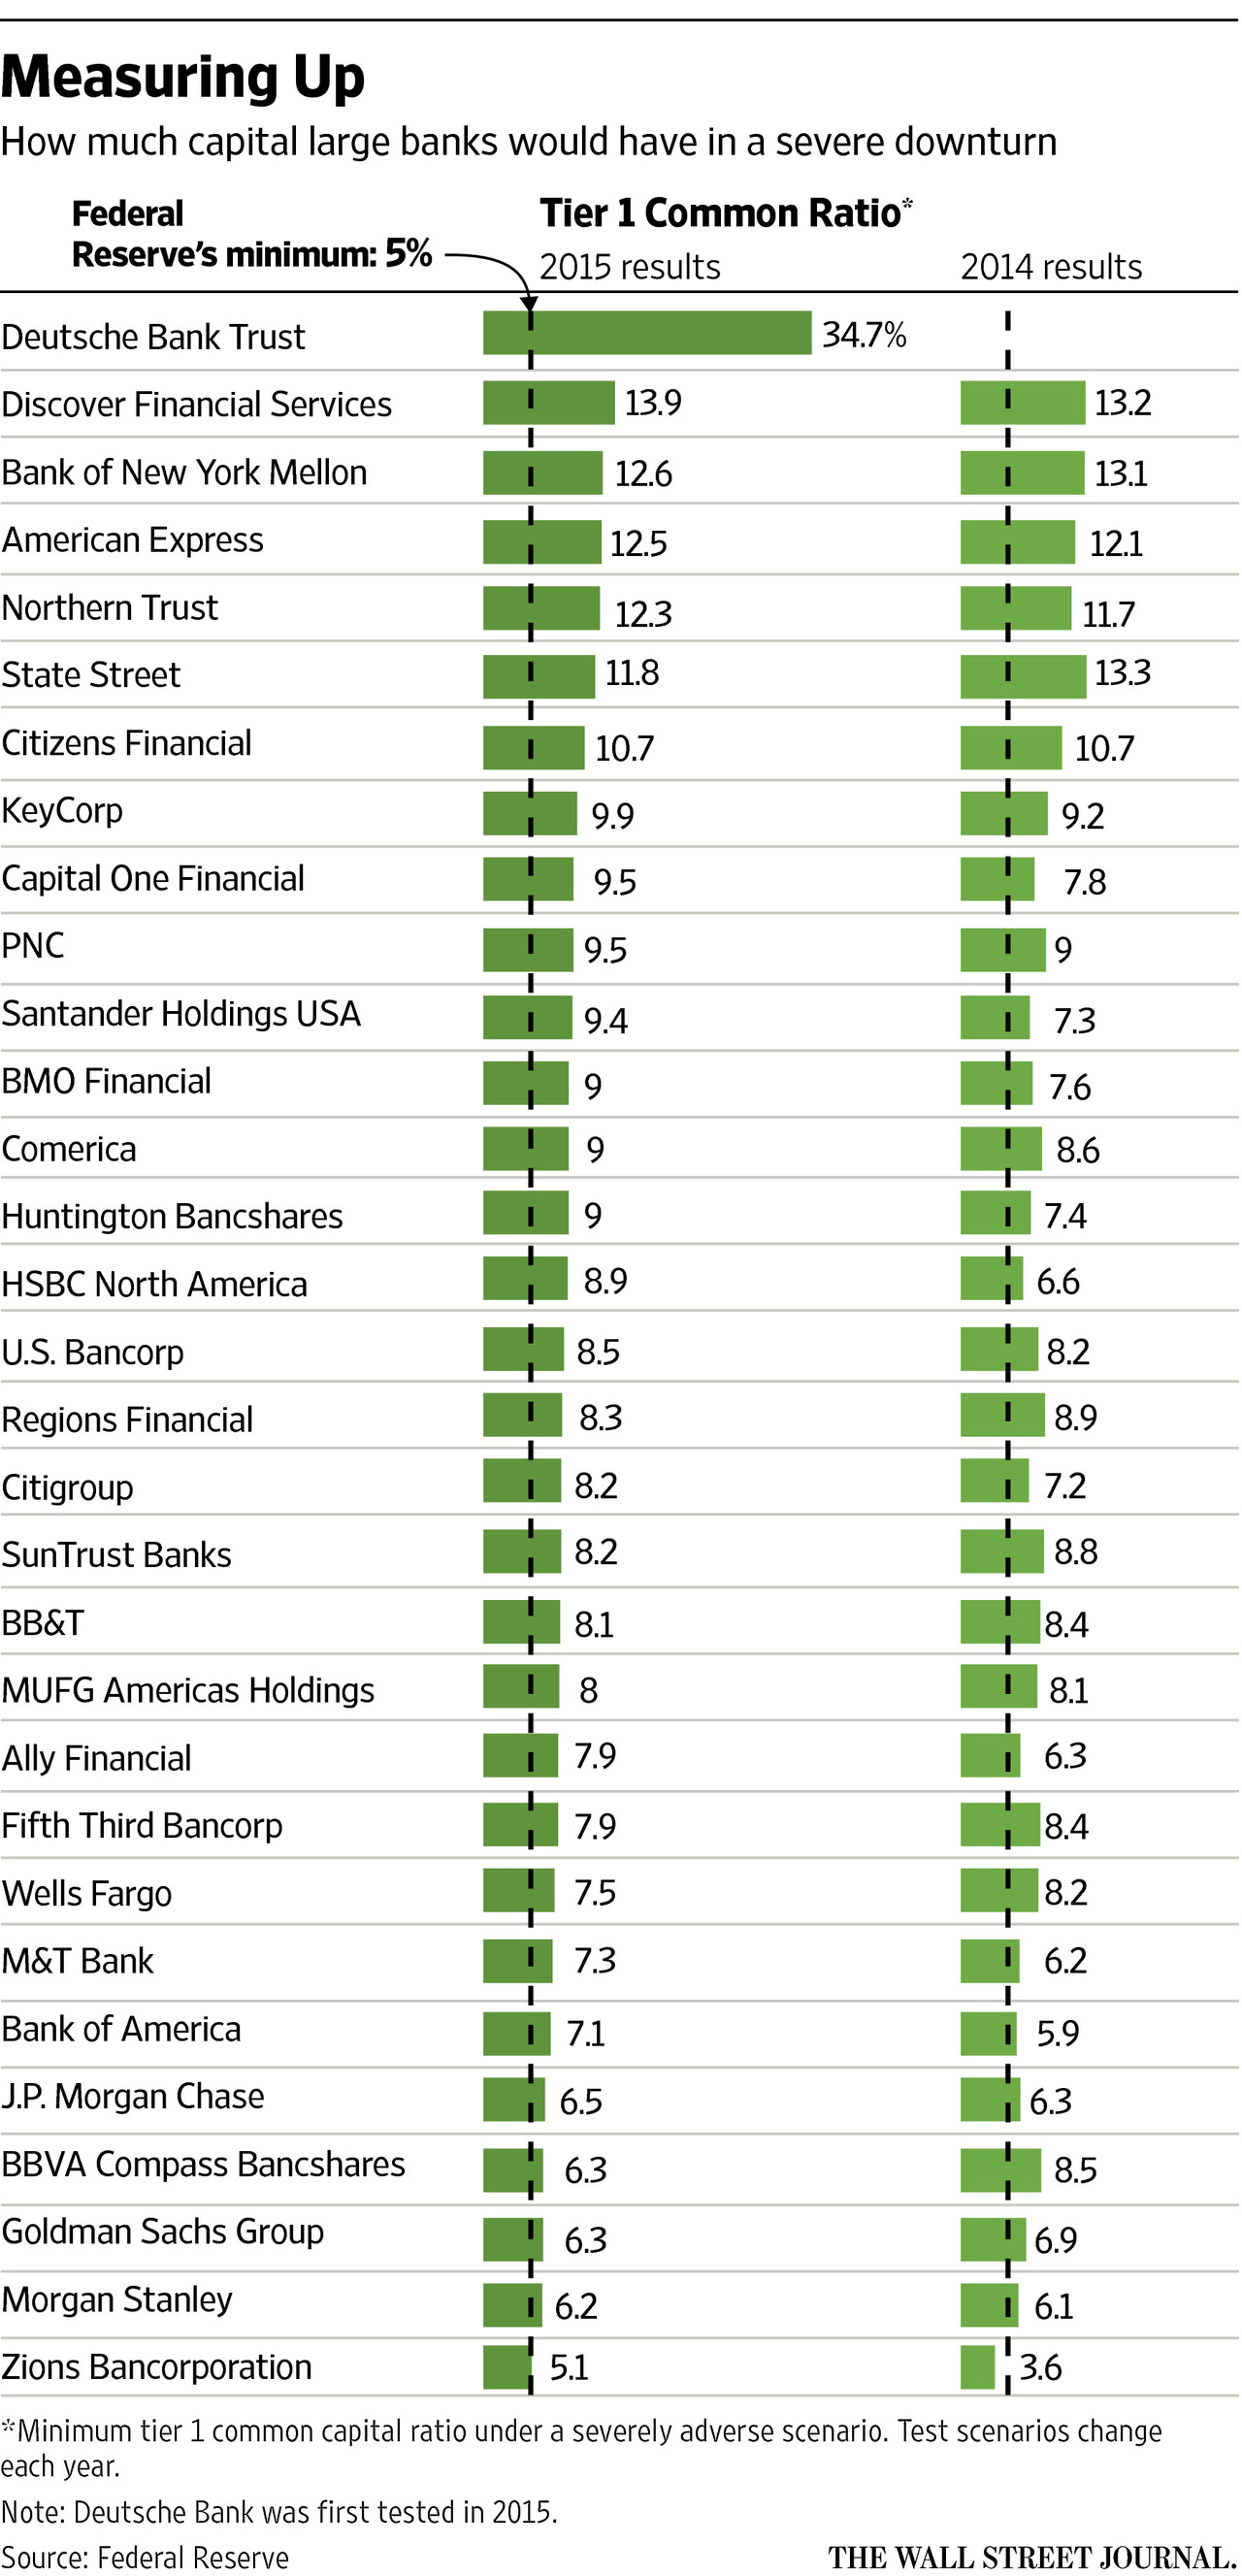
Source: Fed Stress Tests Find Banks Adequately Capitalized, Mar 5, 2015, The Wall Street Journal
The Tier 1 Common Ratio measures the capital adequacy of a bank. The higher the ratio the better the position of the bank in case of surviving a financial crisis.
Some financial institutions such as Discover Financial Services(DFS), Bank of New York Mellon(BK), etc. have substantially higher Tier1 Common Ratio than the minimum required by the Federal Reserve. The smaller Zions Bancorporation(ZION) barely passed the test.
Disclosure: USB, FITB and BBT
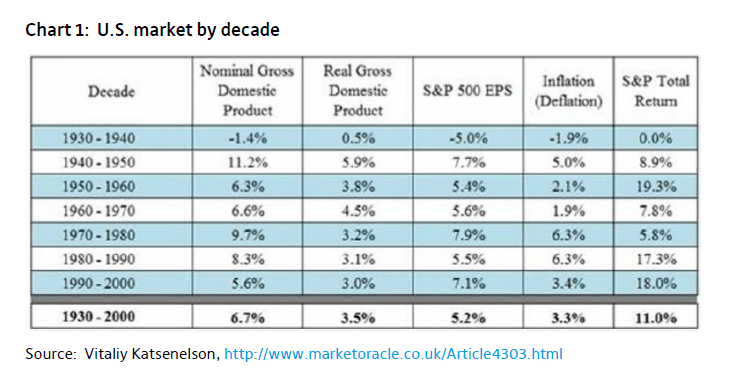
In 2014, the U.S. equity markets had an excellent year with the S&P 500 rising 13.69% including dividends. This year the performance of the index has been average so far. Since the lows attained during the Global Financial Crisis in 2009 the S&P 500 has shot up and has more than doubled. From 2009 thru 2014 except in 2011, the annual total return of the index every year was in double digits. With such great returns year after year investors may be tempted to believe that stocks generally yield 10% or more every year. However that is not true. Equities are unlikely to generate such high returns every year if the past is any indication.
From an article by Niels Jensen of Absolute Return Partners:
Academics operate with an expression called recency. It basically means that we, as humans, assign greater relevance and importance to more recent events than we do to more distant ones. When equities delivered exorbitant returns during the great bull market of 1982-2000, it became the norm to expect double digit returns from equities, despite the fact that equities had rarely delivered such high returns before the 1980s (chart 1).
Click to enlarge
The combination of high debt and deteriorating demographics will almost certainly lead to below average economic growth over the next 5-10 years, and with comparatively low economic growth, low earnings growth will follow. Any other expectation is entirely unrealistic. Now is not the time to be expecting double digit equity returns.
Obviously, rising P/E multiples could still result in decent equity returns, and modestly rising multiples are precisely what I need for the equity market to generate mid-single digit annual returns over the next several years. (For the record, that expectation is driven primarily by the very low interest rates environment.) I just don’t think the multiple expansion is going to be massive, given the very strong headwinds I mentioned earlier.
Source: Tigers in Africa, March 2015, The Absolute Return Letter, Absolute Return Partners
So it is important to remember that returns from equities will be muted moving forward and based on past data and investors have to adjust their expectations accordingly.Double digit returns every year is unlikely.
Related ETF:
Disclosure: No Positions
Also checkout:
From an article on this topic from The Wall Street Journal:
In early January, financial adviser Winnie Sun sat down in her Irvine, Calif., office with a prospective client whose net worth topped $350 million. As they talked, the client told Ms. Sun he expected to make 20% a year in the stock market.
Ms. Sun was taken aback. That is twice the average annual return of the S&P 500 since 1925, once dividends are included.
“I said, ‘I think the main thing you need to realize is that in the past there were extraordinary times when we had great returns but to expect that in the next few years is impractical and somewhat delusional,’ though I didn’t say delusional,” said Ms. Sun, a founder of Sun Group Wealth Partners, with $160 million of assets under management.
The investor, who was in his late 20s and newly wealthy, left the meeting quietly. He reached out to Ms. Sun a week later to tell her he appreciated her frank response but hasn’t put money with the firm.
Investors have reason to expect a lot from stocks. On average, the S&P 500 has returned 18% a year since 2009, including dividends, and from the start of 2012 the index’s total return has averaged 21% a year. That is the S&P 500’s best three-year period since the tech bubble era of 1997 through 1999. Total returns reflect price changes and dividends.
Advisers like Ms. Sun, said that as the bull market rolls into its sixth year, there has been a shift from the dour outlook that followed the financial crisis, in which they often had to cajole clients to keep their money in stocks.
Some advisers said they now have the opposite problem: They have to counter expectations for stock-market returns that are well above long-term averages and fend off demands that advisers put more money into U.S. stocks than the advisers feel is appropriate.
Source: As Bulls Romp, Advisers Aim to Manage Down Expectations, Mar 9, 2015, WSJ
Canada vs. the U.S.: Whose retirement grass is greener? (Financial Post). Related to the UK, see 74% don’t know Isa allowance limits (Money Observer)
10 things you didn’t know about Eurovision (Deutsche Welle)
A tale of three sectors (Allianz’s Unconstrained Thinking)
Why households stay away from the stock market in India (The Hindu Business Line)
The East India Company: The original corporate raiders (The Guardian). This is a long article.
FTSE investor? You’re in great position to benefit from new European QE (MoneyWeek)
‘Worldly life is frightening:’ Famous Siberian hermit prefers taiga to civilization (RT)
Even without the conflict, Russia is bad for Ukraine and the CIS: Fitch (FT beyondbrics)
Searching for Yield Down Under (The Blog, Blackrock) See also ‘Selfie’ Shtick Focuses on Dividends (The WSJ)
Cross-Listed International Stocks: Another Investing Alternative (Charles Schwab)
Two Key Elements to a Better Investment Strategy, (McLean & Partners)

Punta Cana Beach, Dominican Republic
Crude prices plunged dramatically in the past few month from over $100 a barrel to about $60 a barrel for Brent crude. The decline in oil prices also led to the collapse in stock prices of drillers, oil-sector service providers, MLPs, etc. However in the past few weeks oil prices have stabilized and may slowly recover although they may not reach previous levels anytime soon.
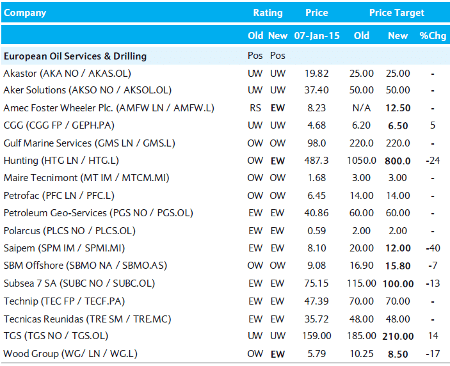
According to a report by Barclays published in January and quoted in a news report, at some point investors may want to consider the European drillers and service providers. From the news story:
Of course, things will not remain this bad forever. Indeed, Barclays can already see light at the end of the tunnel.
“Day by day the picture becomes clearer and we see reasons not to be overly pessimistic – capital discipline in oil is not a new concept, backlogs in [oilfield services] are robust, US$ strength should help, and input prices for projects are falling,” it says.
“More importantly, our analysis shows that relative valuations already factor in scenarios as worrying as 1999 and 2009, but as history indicates, the apocalyptic forecasts at the start of a new oil price period tend to be extreme, and, as oil prices recover, so do earnings estimates. Assuming a more robust 2H15F oil price environment, we see light at the end of the tunnel and remain Positive on a one year view. Today may not be the time to buy the European OFS sector, but as oil prices find a new equilibrium and negative earnings revisions abate, it should soon be time for investors to do their homework.”
Click to enlarge
Source: Barclays
Favouring companies with backlog-driven visibility, Barclays is particularly fond of companies with strong Middle East exposure and existing order book. Picking from the polar market caps, they favour SBM Offshore,Petrofac (PFC), GMS and Maire Tecnimont.
Source: When to buy the oil services sector, Interactive Investor
Investors willing to hold for five years or more can consider nibbling some of these firms at current levels.
Some of the above firms trading on the US markets include Petroleum Geo-Services ASA (PGSVY), CGG (CGG), Technip (TKPPY) and Subsea 7 SA (SUBCY).
Late last year France-based CGG soared after rival Technip made an offer for acquisition. However the deal fell apart and Technip withdrew the offer.
Disclosure: Long TKPPY