Three Reasons Why Investors Should Hold Emerging Market Stocks

Emerging markets have been laggards in the past few years compared to their  developed world peers. Among the developed stocks, U.S. stocks especially had a superb run last year compared to European stocks. However this year, the tables seem to have turned with European stocks outperforming American stocks so far.

With the poor performance of emerging stocks recently some investors may be tempted to dump them altogether now and move their assets to developed stocks. This strategy is not a wise for many reasons. Before we get to those, lets take a quick look at the annual return of emerging market stocks as represented by the MSCI Emerging Markets Index:

Year2014201320122011201020092008
Return-2.19%-2.60%18.22%-18.42%18.88%78.51%-53.33%

Source: MSCI

Since the Global Financial Crisis, emerging stocks returned double digit growth in 2009, 2010 and 2012. But more recently in 2013 and 2014, they performed poorly with negative returns of 2.60% and 2.19% respectively.

Despite losing money in the past two years, emerging stocks still have a place in equity portfolios. The following are a few reasons to hold emerging stocks now:

1. Some emerging markets have strong and growing economies and their equity markets would soar accordingly. For example, last year India was one of the top performing markets in the world while Brazil was not. So one way to profit from growing emerging economies is have to some investments in those countries.

2. Emerging companies have decent dividend yields. More importantly, many are raising their payouts to shareholders as they try to attract domestic and international investors. Even in South Korea, where companies are not known for shareholder-friendly dividend policies recent tax policy changes may make them share more earnings with investors. In terms of emerging dividend yields, the MSCI Emerging Markets Index has a yield of 2.60% as of Feb, 2015. This is better than say the average yield on the S&P 500 which is about 2%. But this does not mean emerging stocks are better than stocks. It simply means that certain developing countries such as those included the MSCI index have firms that pay good dividends. The key is to do research and identify them.

3. One important reason to hold emerging stocks is the concept of diversification means owning laggards. From an article I wrote in December last year quoting Seth J. Masters,Chief Investment Officer of Bernstein Global Wealth Management:

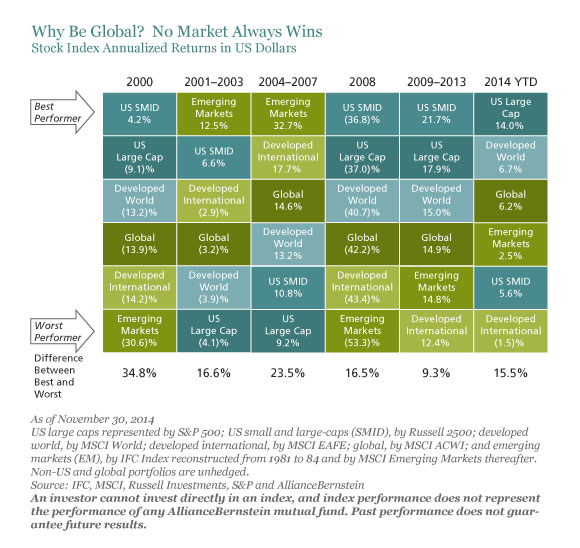
After leading globally in 2013, in 2014 through November the US stock market beat developed international stock markets by 15.5 percentage points in US dollar terms; it beat emerging markets by 11.5 percentage points, as shown in the first Display, below. This outperformance by US stocks has some investors ready to throw in the towel on global investing.

Click to enlarge

Why Go Global

We think selling an asset after a stretch of lagging performance is a bad decision. Often, the lagging asset may be more attractive looking ahead. And that’s what we’re seeing in developed international stocks markets, where valuations are more attractive than in the US stock market.

Since 1990, non-US stock markets have outperformed the US market more than half the time. Since no one can be certain just when this will occur, we think it’s wise to own stocks in all regions.

Investors not already having exposure to emerging market equities can consider adding the following stocks in a phased manner:

1.Company:Taiwan Semiconductor Manufacturing Co Ltd (TSM)
Current Dividend Yield: 2.02%
Sector: Semiconductors & Semiconductor Equipment
Country:Taiwan

2.Company:Empresa Nacional de Electricidad SA (EOC)
Current Dividend Yield: 2.53%
Sector:Electric Utilities
Country:Chile

3.Company: HDFC Bank Ltd (HDB)
Current Dividend Yield: 0.56%
Sector: Banking
Country: India

4.Company:Banco Santander- Chile (BSAC)
Current Dividend Yield: 4.65%
Sector: Banking
Country: Chile

5.Company:Bancolombia (CIB)
Current Dividend Yield: 3.76%
Sector: Banking
Country: Colombia

6.Company: Standard Bank Group Limited (SGBLY)
Current Dividend Yield: 3.84%
Sector: Banking
Country: South Africa

7.Company: Embraer SA (ERJ)
Current Dividend Yield: 1.65%
Sector: Aerospace & Defense
Country: Brazil

8.Company: PetroChina Co Ltd (PTR)
Current Dividend Yield: 4.84%
Sector: Oil
Country: China

9.Company: Malayan Banking Berhad (MLYBY)
Current Dividend Yield: 6.64%
Sector: Banking
Country:Malaysia

10.Company:Philippine Long Distance Telephone Co (PHI)
Current Dividend Yield: 5.59%
Sector: Telecom
Country: Philippines

Note: Dividend yields noted above are as of Feb 20, 2015. Data is known to be accurate from sources used.Please use your own due diligence before making any investment decisions.

Disclosure: Long BSAC

You may also want to check out:

Emerging Market Equities in 2015 – the ugly, the bad and the good, March 15, 2015, Fidelity UK

Comparing the Performance of FTSE 100 and S&P 500

The FTSE 100 Index closed at 7,022 yesterday. It has taken UK’s benchmark index to cross the 7,000 level. Almost 17 years ago the FTSE first reached 6,000. Though the index has reached a milestone, the performance is not that great compared to the S&P 500. U.S. stock have outperformed the FTSE 100 by a wide margin in the past five years as shown in the chart below:

FTSE 100 vs SP500

Data Source:  Datastream from 19.3.10 to 19.3.15, total returns in local currency terms.

Source: Why no-one should be celebrating 7,000 on the FTSE 100 by Tom Stevenson, Fidelity UK

From the article:

The numbers are quite startling. Between 1984 and the day in 1998 when the FTSE 100 exceeded 6,000 for the first time, the 500% rise in the UK market was bettered by the US but not massively so. Over that same period, the S&P 500 rose by 572%.

Since 1998, however, the total return since 1984 has risen to only 596% for the FTSE 100 but to a massive 1,127% for the S&P 500. We look like New York’s country cousins today.

This is surprising when you consider how global markets move, on a day to day basis, in lockstep. A bad day on Wall Street is invariably a bad day in the City too and vice versa.

The reason for the long-term divergence is simple enough to understand, though. It reflects the different make-up of the two markets. The FTSE 100 is increasingly neither a play on the UK economy nor even global growth. It is today more and more a reflection of the outlook for a handful of sectors like mining, oil and gas and banks, none of which are exactly flavour of the month.

The US, by contrast, is home to the industries of tomorrow, notably technology and healthcare. Looked at through the prism of Apple and Google, it is perhaps unsurprising that Wall Street has powered ahead.

Here are a few additional points to remember:

About three-fourths of the revenues of the firms in the FTSE 100 come from overseas. For example, mining is a major sector in the index and the miners have not been performed well in recent years due to the decline in commodity markets. Some of the emerging markets have also been in doldrums hurting the earnings of FTSE 100 firms.

Oil&Gas, Personal and Household goods and banks are the three largest sectors in the index. The Personal and Household goods sector has been adversely by emerging markets and British banks are still suffering from the effects of the global financial crisis. Even Standard Chartered, HSBC(HSBC) and Barclays(BCS) which seemed to be strong during the crisis have seen their share prices fall recently.

Though the FTSE 100 is often used as the benchmark index it is similar to the Dow.Both indices do not represent their respective markets. The FTSE 250 is a better representation of the British economy.

Related ETFs:

  • iShares MSCI United Kingdom Index ETF (EWU)
  • SPDR S&P 500 ETF (SPY)

Disclosure: No Positions

GDP: China vs. India

China and India rank the first and second in terms of population.Each country is home to more than one billion people. While India is a democratic country with a multitude of political parties China is a communist country with only the communist party allowed to exist.

The economic system in China is unique and is called as “Market Socialism” which is a mixture of capitalism and socialism. While China allows private enterprises the state plays a major role in the regulation of the market.

India and China have two of the largest and fastest growing markets among the emerging countries. However China is ahead of India economically and India is playing catch up. Frederic Neuman of HSBC wrote in an article in FT beyondbrics that India has done well so far but has more work to do. From the article:

Click to enlarge

India vs China GDP

Chart 1 (above) makes an easy comparison. It shows the size of the Chinese and Indian economies in trillions of US dollars (the former is over four times as large as the latter). But here’s the twist: we date the respective lines from when officials adopted reforms in earnest (China in the early 1980s, India only in the early 1990s). Note two things. First, India is actually a little ahead of China at the same stage of the development process. Two, in truth, this counts for little because the main “growth spurt” only came thereafter. In other words: India will need to pick up speed in the coming years, ideally raising growth to double digits. Challenging stuff.

Source: Guest post: can India repeat China’s ascent?,  Jan 19, 2015, FT beyondbrics

From a related article in Fidelity UK:

Perhaps one of the most exciting things about India right now is the ambition of the government. It’s thinking big, in terms of infrastructure development and all manner of business reforms.

Take plans to fast-track the regeneration of the country’s vast inland waterways network. The rejuvenation could create vast numbers of jobs, bring trade to poorly linked towns and raise the competitiveness of companies. This is appealing in a country renowned for its overloaded road and rail networks. New inland routes for cargo ships have been mooted as well as new ports and floating hotels1.

The pro-business government’s problem, of course, is age-old and that’s its ability to press reforms and infrastructure programmes through a democratic parliamentary system. It’s a difficulty shared with Japan but not so much China.

Source: How fast can India grow? by Graham Smith, Fidelity UK

Dividend Contribution to Total Returns: A Look at Three Regions

Dividend returns account for a significant part of total returns especially over the long-term in many markets. So it is important to hold dividend-paying stocks in the portfolio. Even a small dividend yield can amplify returns die to the effect of compounding.

How much do dividends contribute to performance? In this post lets take a look at three global regions.

1) Europe:

Click to enlarge

Dividend COntribution-Europe

Dividends have consistently produced a positive return to European stocks since 1970 as shown above. They accounted for 39% of the total returns for the entire period shown in the chart. This is indeed substantial . During periods of stock price declines dividends have helped investors offset the losses. As European companies generally tend to have high payouts, Europe offers a fertile hunting ground for investors looking for income stocks.

2)North America:

Dividend COntribution-North America

In North America also one-third of the returns came from dividends. Though the payout ratio in the U.S. is lower than in Europe, one advantage is that companies have room to raise the payouts should they decide. As large-cap U.S. firms are flush with cash this should not be an issue.

3) Asia excluding Japan:

Dividend COntribution-Asia

Dividends accounted for more than one-third of the total returns in Asia as represented by the MSCI AC Asia ex Japan Index. The definition of this index from MSCI:

The MSCI AC (All Country) Asia ex Japan Index is a free float-adjusted market capitalization weighted index that is designed to measure the equity market performance of Asia, excluding Japan. The MSCI AC Asia ex Japan Index consists of the following 10 developed and emerging market country indexes: China, Hong Kong, India, Indonesia, Korea, Malaysia, Philippines, Singapore, Taiwan, and Thailand.

Source: Dividends instead of low interest rates, March 2015, Allianz Global Investors

Related ETFs:

  • iShares Dow Jones Select Dividend ETF (DVY)
  • SPDR S&P Dividend ETF (SDY)
  • Vanguard Dividend Appreciation ETF (VIG)

Disclosure: No Positions

How to Profit from the Strong Growth of the U.S. Auto Industry

The automobile industry is the second largest and most important to the U.S. economy after the real estate industry. During the global financial crisis auto sales declined with the recession. Since then the industry has picked up steam and continues to show strong growth year after after. The following chart shows the annual growth of auto sales in the country since 1980:

Click to enlarge

US Auto Sales

Source:  Truck Sales Plow Through February, Mar 3, 2015, WSJ

Based on the latest estimates, total sales this year may exceed 16 million vehicles. For a country with a population of about 318 million, 16 million a year is still a big number by any measure. Some of the reasons for investing in the auto sector include:

  • The auto industry employs millions of workers directly and indirectly and will get bailed out by the state in case of financial troubles. The bailout of GM dubbed as “Government Motors” for a while is an example.
  • Public transportation system is non-existent for the most part in all of the country other than the big metros like New York, LA, Chicago, Boston, etc. Hence cars are the only means of transportation for people.
  • So the gas pump can be considered as the umbilical cord of most Americans since without a car and the fuel to make it run survival becomes almost impossible.

Gas-Pump

  • Americans love their cars. So it is not unusual to find families spend more on cars per month than on food or other things.
  • The infrastructure of the country’s whole transportation system is mainly based on autos. For example, sub-urban living and the mall culture cannot exist without autos.

How to profit from growth of auto industry in the U.S.?

The best way to profit from the popularity and dominance of the auto industry is NOT to invest in auto makers but to invest in companies that support the auto industry. Auto makers are saddled with many issues like high wages, legacy costs like pensions, healthcare, etc. So investing in their stocks is not a good idea. Even though it is a oligopoly industry any player could still go bankrupt due to the mentioned issues wiping out equity investors.

Companies provide the nuts and bolts to the auto industry are good options for investments. For example, auto parts makers have a solid business model since they not only supply parts to auto makers for the production of new cars but also sell after-market parts to consumers directly. These firms may include tire makers, auto parts makers, car seat makers, oil companies, etc. Some of the domestic and foreign firms that support the automobile industry are listed below for consideration:

  1. Autoliv Inc (ALV)
  2. Continental AG (CTTAY)
  3. Compagnie Generale DES Etablissements Michelin SCA (MGDDY)
  4. Magna International Inc(MGA)
  5. Denso (DNZOY)
  6. AutoZone, Inc. (AZO)
  7. Nokian Renkaat Oyj (NKRKY)
  8. Johnson Controls Inc. (JCI)
  9. Bridgestone Corp. (BRDCY)
  10. Lear Corp. (LEA)

Disclosure: Long DNZOY, CTTAY

Update:

Looking for the latest auto sales data or wondering which cars are the top sellers in the U.S.? Checkout The Wall Street Journal’s cool Auto Sales page.