Biotech stocks are hot again this year as investors hope for spectacular gains like last year. In 2014, biotech stocks returned more than 34%. While the NASDAQ is up by 7.5% year-to-date (YTD) the NYSE Arca Biotech Index has shot up by 19.2% YTD.
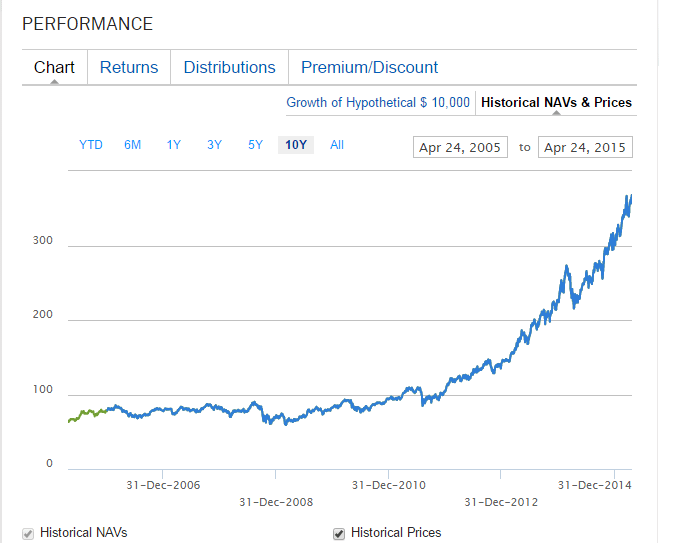
The following chart shows the 10-year price return of the largest biotech ETF – iShares Nasdaq Biotechnology (IBB):
Click to enlarge
Source: iShares
The chart shows that biotechs have taken off like a rocket since 2011 and there seems to be no signs of slowing down.
Though biotech stocks are on an upward trend caution is needed for investors looking to commit new capital to this sector. Here are some of the reasons to be cautious about this sector from an article by Tom Stevenson of Fidelity, UK:
- The graph below shows the MSCI Biotech Index thru late March this year. This chart looks almost similar to the NASDAQ 15 years ago. Biotech stocks have shot up six-fold in the past ten years.
Click to enlarge
- Many start-ups with no revenues or profits are bid up since no-one knows what they are worth.
- About three-quarters of companies in the NASDAQ biotech index have no profits.
- Just five firms account for more than 80% of the sector’s earnings.
- Much of the biotech rally is momentum-driven and unsupported by fundamentals.
Source: Beware the temptation of the biotech bubble, Mar 31, 2015, Tom Stevenson, Fidelity, UK
Some of the largest biotechs by market cap include Amgen Inc. (AMGN), Gilead Sciences Inc. (GILD), Biogen Inc. (BIIB), Celgene Corporation (CELG) and Regeneron Pharmaceuticals, Inc. (REGN).
Nearly 150 biotech companies trade on the NASDAQ with 148 firms included in the The NASDAQ Biotechnology Index. The complete list of biotechs traded on the exchange can be found here. As discussed above, many of these firms are highly risky for long-term investments. The table below shows some of the worst-performing biotech stocks in 2014:
| Company | Ticker | Total return in 2014 (%) |
|---|---|---|
| Nymox Pharmaceutical Corporation | NYMX | -93.4 |
| Elbit Imaging Ltd. | EMITF | -93.1 |
| PhotoMedex, Inc. | PHMD | -88.2 |
| Sophiris Bio Inc. | SPHS | -85.4 |
| WaferGen Bio-systems, Inc. | WGBS | -85 |
| Nanosphere, Inc. | NSPH | -82.9 |
| Cyclacel Pharmaceuticals, Inc. | CYCC | -82.6 |
| MELA Sciences, Inc. | MELA | -81.3 |
| Cytori Therapeutics, Inc. | CYTX | -81 |
| Regado Biosciences, Inc. | RGDO | -80.9 |
| BioLife Solutions, Inc. | BLFS | -80.5 |
| Alcobra Ltd. | ADHD | -79.3 |
| Prana Biotechnology Ltd Sponsored ADR | PRAN | -76.6 |
| Exelixis, Inc. | EXEL | -76.5 |
| Cleveland BioLabs, Inc. | CBLI | -75.6 |
| Kamada Ltd | KMDA | -74.4 |
| Genetic Technologies Limited Sponsored ADR | GENE | -73.1 |
| Acura Pharmaceuticals, Inc. | ACUR | -73.1 |
| Response Genetics, Inc. | RGDX | -72.7 |
| OncoGenex Pharmaceuticals, Inc. | OGXI | -72.5 |
Source: The Worst-Performing Biotech Stocks Of 2014, Forbes
The stocks shown above plunged between a shocking 72% to 93% in just one year. So before investors dive into biotechs they have to be highly selective and allocate only a very small portion of their assets to this sector at current levels, if they decide to invest. Ideally one may want to wait and watch if this rally can hold and stock prices come to sane levels based on fundamentals.
Disclosure; No Positions