Entrenched industries are extremely difficult to disrupt let alone crush in the US. This is because established players have plenty of advantages over newcomers. For instance, these firms have financial strength, years or decades of data, strong networks and in some cases legal, political and regulatory protections. A classic example of where high tech startups failed to revolutionize is the auto dealership industry. During the height of the dot com mania of the late 1990s it was predicted that auto dealers would go the way of the dodo birds as many startups would make online auto buying easier and simpler for customers. However it did not turn out that way. Auto dealers not only beat their silicon startups but more recently thrived when auto prices soared. Trying to eliminate these middlemen is like someone trying to write a new constitution for the country and replace the current one.
Another industry where startups failed miserably to uproot traditional companies is the insurance industry. This includes auto, home and health. A few years ago many startups went public in this space with the hype and hope to redo this industry and be profitable as well. A recent journal article discussed the failure of insuretechs. From the piece:
In theory, few industries should be easier to shake up than insurance, which scores very low on customer satisfaction and is run by big, boring corporations set in their own ways. Data and statistics have been at its very core ever since British mathematician James Dodson created the Equitable Life Assurance Society in the 18th century.
As a result, venture capitalists love it: According to reinsurer Gallagher Re, they poured $49 billion into insurtech between 2014 and 2022. Funding fell back last year, but mostly because 2021 was wild.
Unlike moonshots that promise air taxis or space tourism, these startups have sensible pitches. Root, which is backed by online used-car retailer Carvana, saw that the riskiness of drivers tends to be assessed through broad-brush variables such as age and occupation, leaving a gap for using telematics to assess individualized behavior, including factors such as gentle turning or not answering texts while driving.
Similarly, Hippo employs “smart home” kits to constantly monitor risks of fire, water and other damages. Lemonade uses AI and techniques from behavioral economics to fast-track all types of insurance.
Yet the revolters have failed to storm the gates.
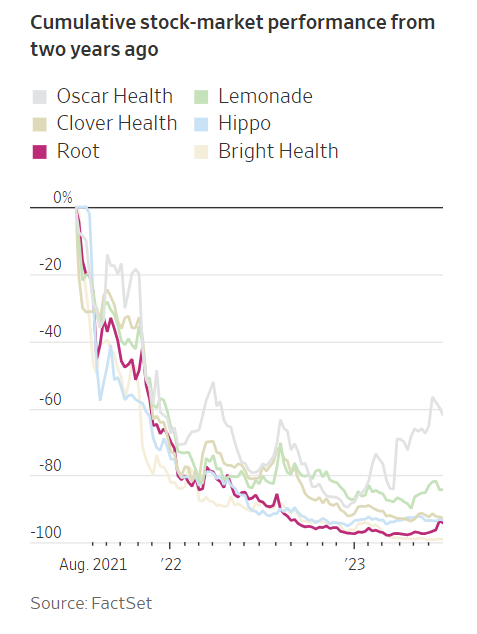
Root’s business has slowed lately, a red flag for investors looking for fast-growing companies with potential economies of scale. Even more concerning is that new technologies haven’t yet proven that they are better at pricing risks: Old-school insurers still have lower claims relative to premiums than insurtech firms, though the record of the latter group is improving.
The digital age has never shown much sign of threatening insurance giants. They haven’t seen their market share eroded or even had to adapt their businesses much. Price-comparison websites may have injected some extra competition, but people haven’t fundamentally changed how they buy insurance, even as they embraced online apps to hail rides, get food delivered or go on vacation. That suggests even the takeover value of insurtech stocks may be low.
As it turns out, incumbents had good reasons to be conservative. “20 years ago we thought distribution costs would be lower using the internet, but this is absolutely not the case: Paying Google is more expensive than paying an agent,” said Frédéric de Courtois, group deputy chief executive of French insurer Axa.
Source: Curb Your AI Enthusiasm: Just Look at the Insurtech Carnage, WSJ, June 28, 2023
The key takeaway is that investors need to be aware of the risks involved with the startups that promise to modernize an industry. It is easy to fall for the hype of silicon valley.
Of course insurance is not the only industry that needs to be redone. Other industries such as airlines, auto, rail, tax preparation, medical devices, dental, telecom, media, retail, etc. and many more needs serious competition as well. Instead of true disruptions of these industries silicon valley is more likely to promote yet another Twitter or Facebook and the like.
Referenced companies:
- Root Inc (ROOT)
- Lemonade Inc (LMND)
- Hippo Holdings Inc (HIPO)
- Oscar Health Inc (OSCR)
- Bright Health Group Inc (BHG)
- Clover Health Investments, Corp. (CLOV)
Disclosure: No positions