Happy Valentine’s Day !
Bloomberg BusinessWeek magazine has the following cool cover:
Click to enlarge
Source: Oil Is the Cheap Date From Hell, Bloomberg BusinessWeek
Here is an excerpt from the article:
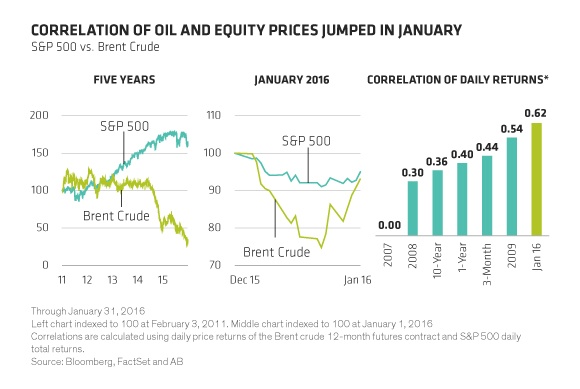
Just in time for Valentine’s Day, it appears that oil and stocks have developed an unhealthy, codependent relationship. They’re way too deep into each other. Where one market goes, the other follows. If they were people, a counselor would be urging a trial separation. “This is highly unusual,” Torsten Slok, chief international economist at Deutsche Bank, wrote to clients in late January. “Call it the oil correlation conundrum.”
The full article is worth a read.
As equities of all sectors are getting thrashed due to oil prices, plenty of attractive opportunities are popping in the markets. Investors with cash to deploy can take advantage of the current chaos. Just because oil prices have collapsed doesn’t mean people will stop using less electricity or natural gas or stop brushing their teeth, stop or reduce buying groceries, stop buying cereals, etc. Or for that matter people are not going to stop doing things that some may consider sins such as drinking alcohol, gambling in lotteries and casinos, smoke cigarettes, etc. Generally sin stocks tend to perform well in both good times and bad. For example, during economic expansions consumers drink more beer to enjoy life and celebrate the good time. But at the same time, when they are depressed they also drink more to bury their sorrow and escape from pains at least temporarily. Hence wise investors with a long-term outlook can pick up stocks in many of these sectors that are on sale now.
You may also like:
- The Correlation Between Stock Markets And Oil Prices Remains High, TFS, Feb 9, 2016