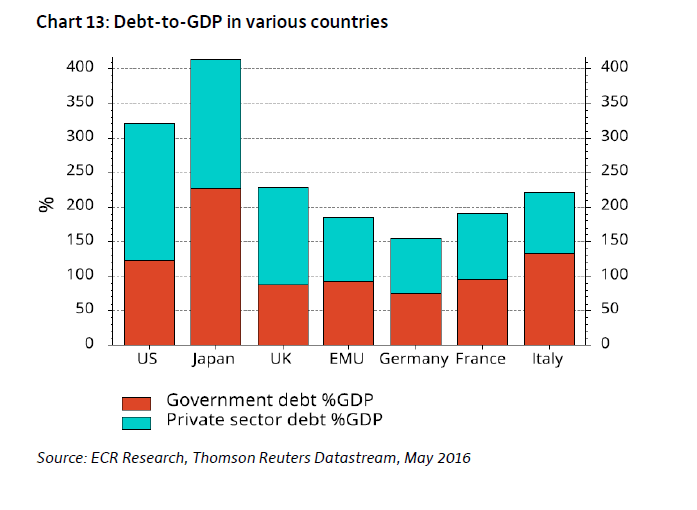
Debt to GDP Ratio of Select Countries

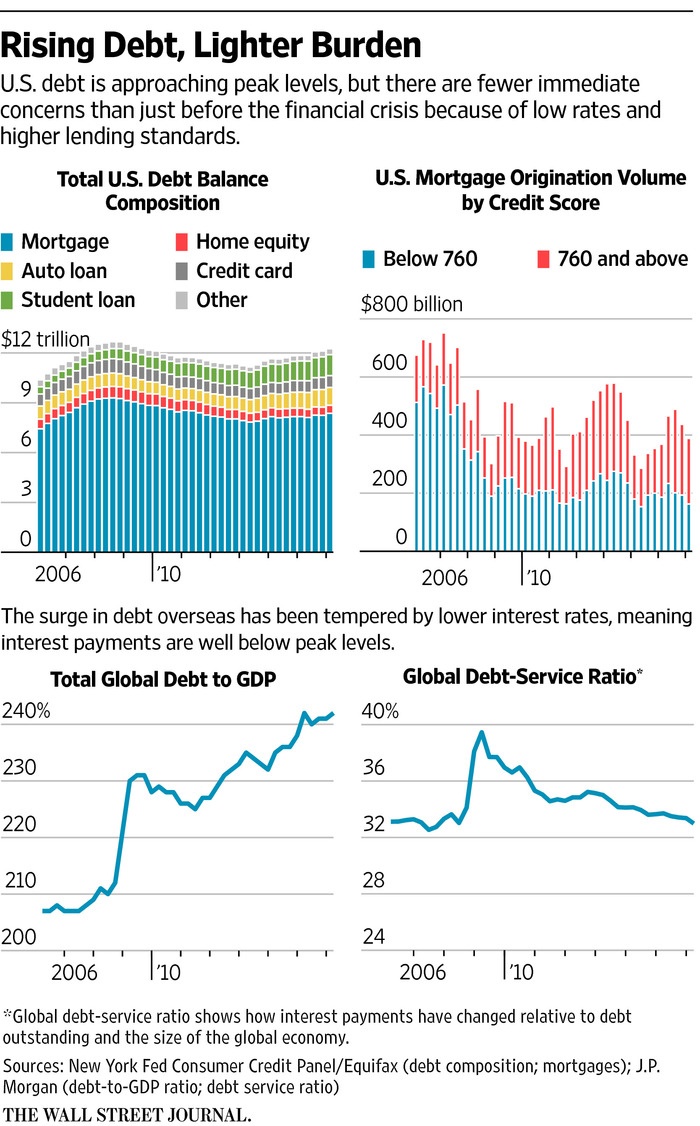
Debt levels have increased globally since the financial crisis of 2008-09. Both government and private debt have soared after the crisis. The following chart shows the Debt to GDP Ratio of select countries:

Click to enlarge

Debt to GDP in select Countries

Source:  The Absolute Return Letter June 2016, Absolute Return Partners

Japan has the highest debt with the debt-to-GDP ratio well above the 400% mark. The US figure is also high at over 300%.

Franklin Templeton: European Financials Are On Sale Now

European financials are under-performing so far this year. Banking stocks in particular have declined heavily due to a multitude of factors including fears of UK exiting from the EU.

Unlike the swift recovery of US banks, European banks never full regained their glory since the peak of the global financial crisis. Years of poor returns due to one crisis after another has left a poor taste for European banks among global investors. In short, European financials are rightfully being treated as rotten fish by investors.

Despite the negative sentiment, however, light may be at the end of the tunnel. According to a report by Franklin Templeton Investments, European financials are selling at a deep discount and offer attractive opportunities now.

From the report:

Investors appear to have completely lost confidence in European banks, and they have shown their disdain so far this year in the same way they have since the 2008-2009 financial crisis: When they hear a shred of negative economic news, they sell off the banking sector. Bank stocks have dropped 20% year-to-date,1 compared with European equities overall, which have slid a comparatively modest 4% during the same time frame.2

european-banks-price-to-book-ratio

The malaise has dragged down the banking sector’s price-to-book (p/b) ratio3 toward lows it reached during the financial and European sovereign crises. And at 0.7, the sector’s p/b ratio is less than half its long-term average of 1.6.4 In our view, the banking sector is trading at extremely attractive levels, and we believe select banking and financial franchises have become excessively discounted, particularly taking into account what we consider bright spots on the horizon, which include a pickup in loan activity and increased dividend payouts.

What has stoked investor worries so far this year? The list features what we call the “triple whammy”: energy-company weakness, regulatory concerns and, perhaps most worrisome, negative interest rates.

Notes:

1. Source: STOXX Ltd., as of May 16, 2016. European banking stocks are represented by the STOXX Europe 600 Banks Index. Indexes are unmanaged, and one cannot invest directly in an index. They do not reflect any fees, expenses or sales charges. Past performance is not an indicator or a guarantee of future performance.

2. Source: STOXX Ltd., as of May 16, 2016. The overall European equity market is represented by the STOXX Europe 600 Index. Indexes are unmanaged, and one cannot invest directly in an index. They do not reflect any fees, expenses or sales charges. Past performance is not an indicator or a guarantee of future performance.

3. The price-to-book (P/B) ratio is calculated by dividing the current closing price of a stock by its book value for the most recent quarter-end. For an individual company, the price-to-book (P/B) ratio is the current share price divided by a company’s book value (or net worth) per share. For an index, the P/B ratio is the weighted average of the price/book ratios of all the stocks in the index.

4. Sources: FactSet, MSCI, as of March 31, 2016. European banking stocks are represented by the MSCI European Banks Index. For additional data provider information, see www.franklintempletondatasources.com.

Source: Can European Banks Rebound from the “Triple Whammy”? by Cindy Sweeting and Peter Wilmshurst, Franklin Templeton, May 31, 2016

The STOXX® Europe 600 Banks Index which is the proxy for banks in Europe is down by 17% in the past 5 years in US dollar terms.

Click to enlarge

Euro Stoxx bank Index 5 Years Return

Source: STOXX

Among the constituents of this index, investors can consider ING Groep NV (ING), UBS AG (UBS),Nordea Bank AB (NRBAY), BNP Paribas SA (BNPQY) and Swedbank AB (SWDBY)

From a related article by Jason Zweig at WSJ:

Europe and emerging markets joined the U.S. this past week in rallying 2% to 3% as oil prices stabilized and investors became more comfortable with a possible interest-rate increase by the Federal Reserve next month. But stocks remain much cheaper overseas than in the U.S.

Consider price to book value, a measure of corporate net worth. Since 1970, according to data from MSCI, the average price to book value of European stocks has been about 25% below that of U.S. stocks. As of April 30, it is 40% lower. The dividend yield on European stocks, historically about one-third higher than in the U.S., is 69% higher.

Source: Hold Your Nose and Buy Europe, Jason Zweig

Disclosure: ING and SWDBY

On The US Trade With TPP Countries

The Trans-Pacific Partnership (TPP) is a trade agreement among 12 Pacific Rim countries. Like other trade deals in the past, this new agreement aims eliminate hundreds of taxes and tariffs between member countries and make trade easier and efficient effectively benefiting all members.

Click to enlarge

TPP Countries Map

The US will be the largest trade partner within the TPP countries.

Click to enlarge

US-Total-Trade-with-TPP-Countries

TPP countries account have a combined GDP of about $28 Trillion or about 40 percent of the world GDP. They also account for one-fourth of total global exports. So the numbers related to TPP are huge.

Since some countries such as the US runs trade deficits with countries like Vietnam and Japan. From an employment perspective,  TPP can generate well-paying middle-class jobs for American workers since US exports to other TPP partners will grow. Higher imports from TPP countries will also benefit consumers in the US.

Sources:

Outstanding US Corporate Debt, Not Cash Held, Is Important To Consider

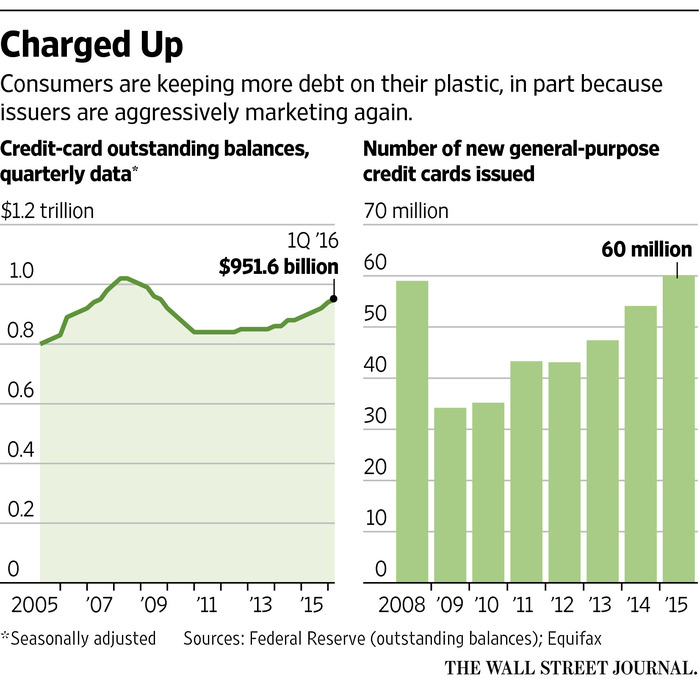
Investors tend to focus on cash held by US corporations rather than their outstanding debts. All too often investors analyze and wonder about all the cash and cash equivalents held by large US firms. Every now and then the media also publishes a report on the cash pile that American corporations are hoarding within the country and also overseas. Cash held by US firms in foreign countries get more attention as supposedly they are unwilling to repatriate the funds to the US due to heavy tax burden imposed by the government. As a result, the story goes, that billions of dollars languish abroad in many tax havens or simply lie unused for any productive purpose.

Instead of focusing on the cash held, investors should be more worried by the debt mountain that American firms have built over the years. This outstanding debt runs in the Trillions and continues to grow year after year. The availability of cheap funds only encourages these firms to gorge on more debt even when they do not have any investment planned for the funds.

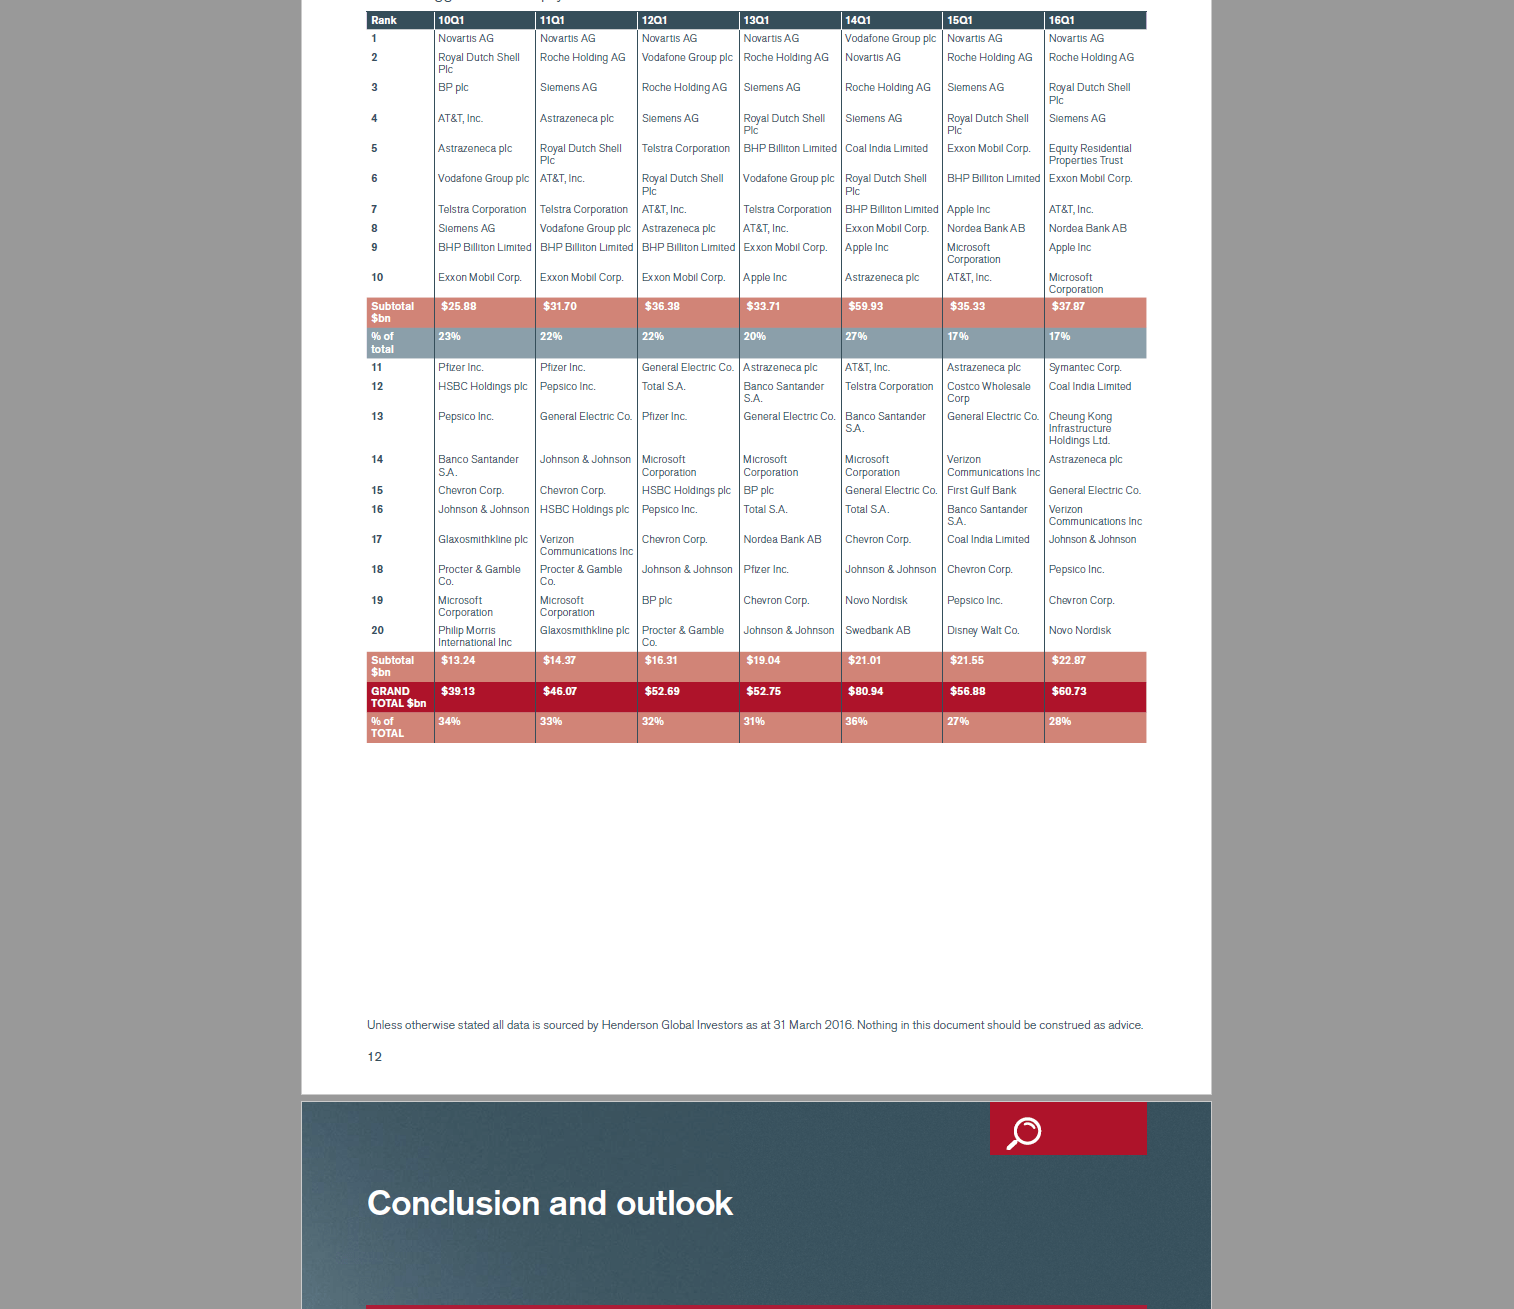
The chart below shows the top 10 firms by cash held:
Top Cash-rich US Companies

Source: Business Insider via Vestact

The above chart shows only one side of the equation. As mentioned above the debt held by companies is much higher than the cash held. The following chart shows the total outstanding US corporate debt by year:

Click to enlarge

US Corporate Debt Outstanding by Year

Source: SIFMA

Since the global financial crisis, ultra-low rates, have led to soaring debt levels. At the end of 2015, this debt figure stood at over $8.1 Trillion.

One way corporate America is taking advantage of cheap money is to issue debt and use the funds to pay as dividends to equity investors or buy back own shares to increase the stock price. This strategy is being played out when earnings are substantially down and nowhere near pre-crisis levels. So in a nutshell, though profits are down companies are able to create the illusion that everything is great by simply borrowing money to keep equity investors happy.

Leverage by US corporations is also rising according to a January article at Bloomberg. From the article:

There’s been endless speculation in recent weeks about whether the U.S., and the whole world for that matter, are about to sink into recession. Underpinning much of the angst is an unprecedented $29 trillion corporate bond binge that has left many companies more indebted than ever.

Whether this debt overhang proves to be a catalyst for recession or not, one thing is clear in talking to credit-market observers: It’s a problem that won’t go away any time soon.

Strains are emerging in just about every corner of the global credit market. Credit-rating downgrades account for the biggest chunk of ratings actions since 2009; corporate leverage is at a 12-year high; and perhaps most worrisome, growing numbers of companies — one third globally — are failing to generate high enough returns on investments to cover their cost of funding. Pooled together into a single snapshot, the data points show how the seven-year-old global growth model based on cheap credit from central banks is running out of steam.

“We’ve never been in a cycle quite like this,” said Bonnie Baha, a money manager at DoubleLine Capital in Los Angeles, which oversees more than $80 billion. “It’s setting up for an unhappy turn.”

Here is an excerpt on buyback programs and earnings decline from a report by Niels C. Jensen at Absolute Return Partners of UK:

Excessive stock buy-back programmes
The next one is one we all know about – stock buy-back programmes. Buying back your own company’s shares enhances EPS in the short term, which is typically rewarded by investors here and now. Take the U.S., where buy-backs totalled $1.1 trillion last year. The flipside of that is a deteriorating capital stock. Companies under-invest as a consequence of spending their free cash flow (and sometimes more) on buying back shares and, as a result, the capital stock ages, and it shrinks. Private, domestic investments, measured as a % of GDP, are now at the lowest point for the past 60+ years. Under-investing today reduces profitability tomorrow, and the extraordinarily low U.S. private, domestic investments therefore paint a very dark picture for the profitability outlook of the U.S. corporate sector.

Meanwhile, U.S. corporates are leaving investors with an illusion of improved profitability, but the true story is quite different. Whereas S&P 500 EPS rose marginally from 2014 to 2015, ‘proper’ earnings (GAAP earnings) actually dropped almost 15%. That is likely to come back and bite investors in the derriere at some point.

Source: The Absolute Return Letter, May 2016, Absolute Return Partners

Knowledge is Power: Commodity Bear Market, Tarnished Treasures, Misinformed Edition

Punta Cana Beach-Dominican Republic

Punta Cana  Beach, Dominican Republic