Investors Still Have Unrealistic Income Expectations And Shorter Holding Periods: Infographic

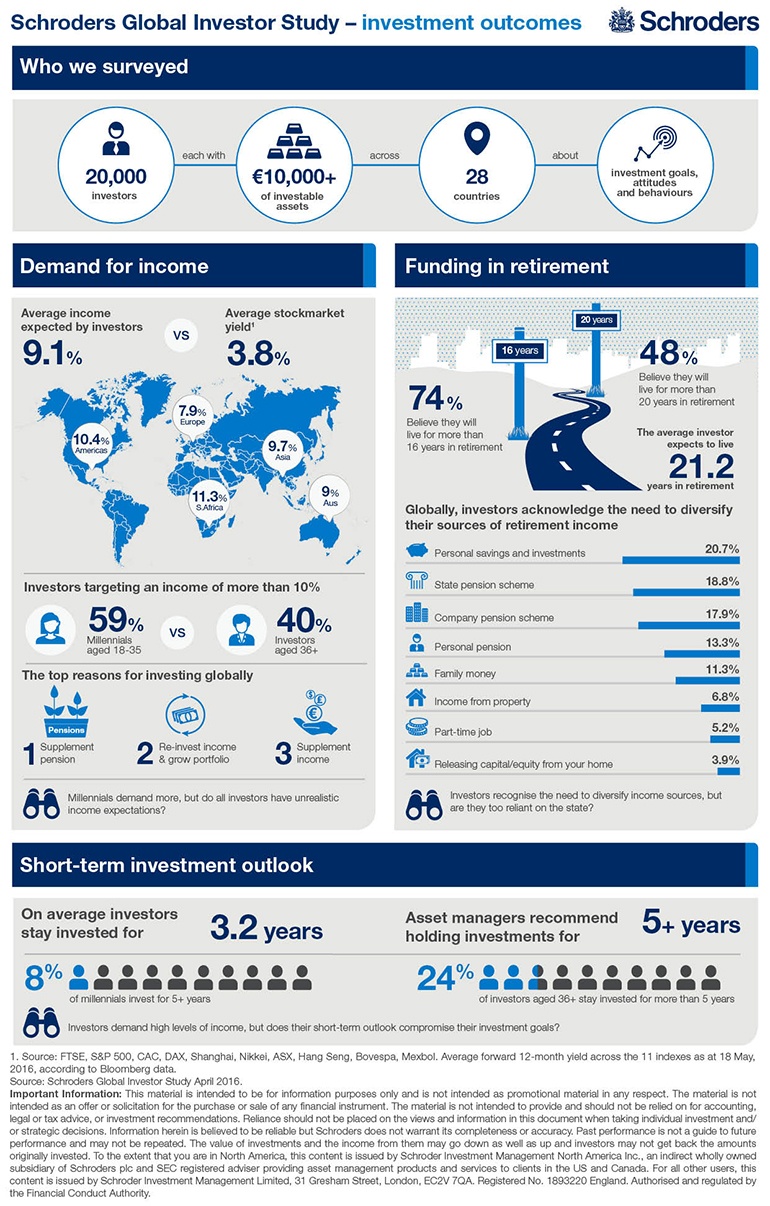
Many investors expect high income from their investments but hold their investments for shorter periods according to a study by Schroders. For example, investors want to generate an income of 9.1% while the average equity market yield is just 3.1%. Similarly in terms of holding periods, the average holding period is just 3.2 years much less than the period recommended by asset managers.

Click to enlarge

Global-investor-study-invesment-outcomes-Infographic

Source: GLOBAL INVESTOR STUDY: Investment outcomes – Infographic, Schroders

Generally though investors want high returns (both income and capital gains) from equities, their patience for holding them for many years is too low. For example, in the US the average turnover of stocks was an astonishing 307% last year and an investor held stocks for just 17 weeks.

Knowledge is Power: Brexit, REITs, Equity Fear Factor Edition

Punta Cana Domincan republiC

Street Scene in Punta Cana, Dominican Republic

Maximum State Pension and Pension Age in Select Countries

Most developed countries offer a decent pension to their retired citizens, However the annual amount paid out to retirees varies from one country to another. In addition, the retirement age to qualify for a state pension also differs slightly between countries.

The following table shows the maximum annual state pension and the state retirement age for select countries:

Click to enlarge

OLYMPUS DIGITAL CAMERA

Source: Are investors too reliant on the state?, Schroders

Among the developed countries, France has the lowest retirement age. This is not surprising since the country is a nanny state with the French expecting the state to take care of them from cradle to grave. Hence the current state proposals to reform labor are met with protests across the country causing chaos to millions to locals and tourists alike.

In the US, the retirement age to receive state pension is 66. Despite the myth about most Americans not trusting the state and worship of free market ideologies,  the majority of them depend on the state pension after their retirement for basic survival. The high dependency of Americans on the state is because private source of funds for retirement like 401Ks, savings, company-paid pensions, investments, etc. are not available or dependable for retirees. Since social security is guaranteed and one cannot lose it like with stocks and other asset types, retirees depend on Uncle Sam more than any other sources.

The Components of the US GDP

Earlier this week in an article on rising consumer debt I wrote that as a consumption-driven economy, the US economy needs consumers to do the heavy-lifting. So far consumer are doing their part and the economy is recovering. But the question is: How big is consumption spending in terms of the total economic output? Or put another way, how important is consumption to the overall US economy?

The following chart from Lord Abbett shows the components of the US GDP:

Click to enlarge

Components of US GDP

Source: U.S. Stocks: Small- and Mid-Caps’ Home-Court Advantage, Lord Abbett, May 31, 2016

According to the article, the US economy is uniquely dependent on the consumer. In fact, consumption accounts for about two-thirds(or 68.5%) of the US GDP as shown above.

Unlike the US, Germany and China are export-driven economies. So total US exports account for only 13% of US GDP. Germany’s export sector comprises about 46% of the German GDP and China’s exports constitutes about 23% of the economic output.

From an investment standpoint, the important point to remember is as long as the American consumer is able to have a job and access cheap credit, housing values remain stable and the consumer feels confident about the future, US economy will continue to remain strong.

Dow Jones Industrial Average ETF vs. Euro STOXX 50 ETF

The Dow Jones Industrial Average (or) Dow Jones Index is oldest benchmark in the world. Dow Jones is also the most popular index that tracks the US equity markets though the S&P 500 is a better representation of the US market.

Similar to the Dow Jones, the EURO STOXX 50 Index, is Europe’s leading Blue-chip index for the Eurozone countries. The 12 countries represented in this index are Austria, Belgium, Finland, France, Germany, Greece, Ireland, Italy, Luxembourg, the Netherlands, Portugal and Spain. UK is not included in this index since it has its own currency.The index is comprised of 50 companies which can be found here.

In order to compare the performance of the Dow Jones Index and the Euro Stoxx 50 Index I used the ETFs (DIA and FEZ) that track the respective indices. The 5-year return chart shows the wide gap in performance between Eurozone stocks and their American peers. Unlike the US, European countries never fully recovered from the crisis of 2008-09 and continued to suffer many other sovereign debt crises including the perennial Greek debt drama. Political infighting between member nations of the EU and general dithering in taking effective and quick actions by regulators and policy makers alike have left Eurozone firms under-perform relative to US firms.

Click to enlarge

FEZ vs DIA-5 Years

While the US stocks as represented by the Dow Jones ETF has soared by nearly 50%, Eurozone stocks have declined by about 14%.So the actual difference in returns 64%.

The following is a long-term chart showing the 10-year price returns:

Click to enlarge

FEZ vs DIA-10 Years

** NOTE: Returns shown above are as of June 3, 2016.

Source: Yahoo Finance

The long-term return does not look good either for the Euro Stoxx 50 ETF as it has plunged by about 28% while the Dow Jones ETF has sailed smoothly all along for a gain of 59%.

It remains to be seen if this divergence will continue to widen or European stocks will beat US stocks for a change. After so long being poor performers it is about time that European firms show their strength in earnings growth and consequently higher valuation for their equity prices by investors.

Related ETFs:

  • SPDR Dow Jones Industrial Average ETF Trust (DIA)
  • SPDR EURO STOXX 50 ETF (FEZ)

Disclosure: No Positions