China’s Roller Coaster Stock Market Returns

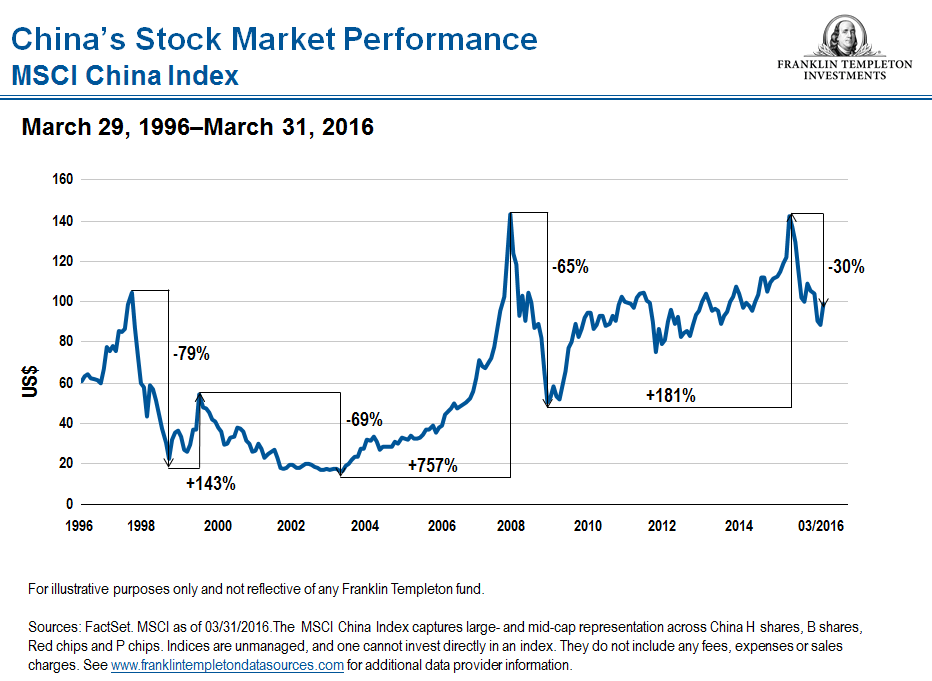
The Chinese equity market is characterized by booms and busts. Since 1996, the upward and downward movements in the market has been violent. For example, during the Global Financial Crisis of 2008-09 the MSCI China Index lost 65% of its value. From 2004 thru the peak in 2008, the index soared by an astonishing 757%.

Click to enlarge

MSCI China Returns

Source: We Still Don’t See a China Hard Landing, Mark Mobius, Franklin Templeton Investments, May 9, 2016

A few facts on the China stock market from the above Mobius article:

China’s A-share market is large, with more than 2,000 companies listed on the Shanghai Stock Exchange and about 1,000 listed on the Shenzhen and other stock exchanges in China. Quoted in local currency, only residents of the People’s Republic of China (PRC) or those under the Qualified Foreign Institutional Investor (QFII) and Renminbi Qualified Foreign Institutional Investor (RQFII) schemes can trade A-shares, which are considered the “domestic” market. The main characteristic of the domestic market is that it’s dominated by retail investors, so there are often big swings that tend to be tied to short-term investor sentiment rather than longer-term fundamentals. Index provider MSCI has been considering the inclusion of the Shanghai domestic market in its benchmark indexes, and it has even been talking about including 5% of China A-shares’ free float-adjusted market capitalization in the MSCI Emerging Markets Index. MSCI is expected to announce its decision in June 2016, and if A-shares are included, we would anticipate increased foreign investor interest in China’s domestic market.

The MSCI China Index captures large- and mid-cap representation across China H-shares (securities of Chinese companies traded in Hong Kong and quoted in Hong Kong dollars), B-shares (securities of Chinese companies that trade on either the Shanghai or Shenzhen stock exchanges and quoted in US or Hong Kong dollars), Red chips (companies outside the PRC traded in Hong Kong, but owned directly or indirectly by mainland Chinese state-entities) and P chips (companies outside the PRC traded in Hong Kong and owned by individuals in mainland China).

Here are a few points to remember before investing in China:

  • Just like other emerging markets Chinese equities will always be volatile.
  • As China follows a cross between democracy and communism, it will always be more unpredictable in terms of market interventions by the state, As a result, extreme booms followed by busts are to be expected.
  • As retail investor participation is high in the domestic market, any sign of volatility or bear market leads to panicked investors running for the exit. On the other hand, soaring stocks lead more mom-and-pop investors bid up share prices to the stratosphere.
  • While much of the growth in the past came from infrastructure investments, currently the state is trying to change the economy to a consumption-based economy. This process will take many years and there is no guarantee of success. As a result, infrastructure-based firms are not going to see their stocks sky-rocket any time soon.
Canada: Households’ Savings Rate and Indebtedness Ratio

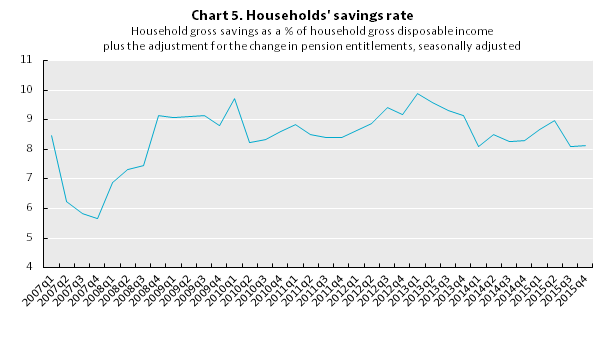
The Canadian Household Savings Ratio stood at 8.1% in Q4, 2015 according to a new report by the OECD. Currently the US personal savings rate stands at 5.4%. The savings rate in Canada tend to be traditionally higher than in the U.S.

Click to enlarge

Canada-Household Savings Ratio

However Canadian household’s debt is also growing at an alarming rate. Much of the debt is due to taking on huge mortgages to buy houses. Since house prices are artificially inflated to bubble levels, it is not uncommon for people to pay a million C$ with a mortgage for a run-down shack-like houses in places like Vancouver.

An excerpt from the OECD report:

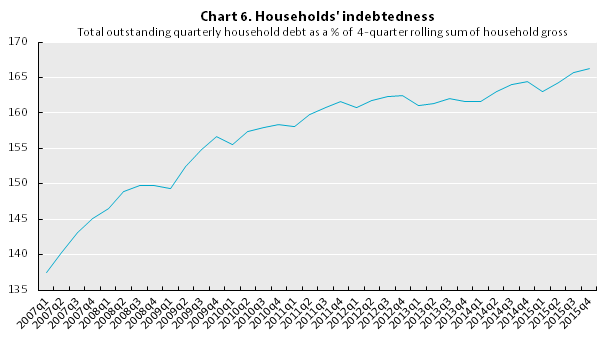
The households’ indebtedness ratio (i.e. the total outstanding debt of households as a percentage of their disposable income) is a measure of (changes in) financial vulnerabilities of the household sector  and its evolution over time allows for an assessment of households’ debt sustainability. In Q4 2015, household indebtedness in Canada (Chart 6) increased to 166.2% of disposable income, its highest level since 1990. As mortgage debt makes up the largest component of household debt in Canada, Chart 6 shows that Canadian households have continued to increase their borrowings to finance house purchases, in the face of low interest rates and high house prices.

Click to enlarge

Canada-Household Indebtness

Source:A dash of data: Spotlight on Canadian Households, OECD Insights, May 10, 2016

The Leverage Ratio of Canadian Banks Has Declined

The leverage ratio measures the ability of a bank to absorb losses. This ratio is important because soundness of a bank is put to test during a financial crisis and strong banks usually tend to weather storms than weak banks. During the 2008-09 crisis, many small banks in the US failed due to this factor.

From an article published in the Financial Post on the state of Canadian banks:

Canada’s banks, touted as the world’s soundest for eight straight years by the World Economic Forum, have become laggards to global peers on a key gauge of their ability to absorb losses.

The leverage ratio, a standard introduced globally by the Basel Committee on Banking Supervision after the 2008 financial crisis, measures Tier 1 capital as a per centage of total assets. After once boasting world-beating capital levels that helped them weather the crisis and even expand as some global competitors retrenched, Canadian banks’ advantage has dissipated under the new rules.

The country’s six biggest banks’ leverage ratio averaged 3.9 per cent at the end of January, trailing the 4.6 per cent average of Europe’s 15 largest lenders and 6.6 per cent average for the top six U.S. banks as of Dec. 31, according to calculations based on company filings. The higher the lenders’ ratio, the more capital it has available to absorb losses. A year earlier, the U.S. advantage was narrower and European banks were basically on par with the Canada.

“This is the weak spot for the Canadian banks,” said Doriana Gamboa, senior director of financial institutions at Fitch Ratings Ltd. in New York, adding that banks outside Canada have been gaining in capital strength. “Globally, there is a big push by regulators in terms of capital and having banks hold more.”

Source: Once touted as world’s soundest, Canadian banks are falling behind global peers on a key strength gauge, Financial Post, May 10, 2016

Despite the lower leverage ratio, Canadian bank stocks are good to hold for long-term investment. They tend to offer stable and growing dividends with some price appreciation year after year like clockwork compared to other developed world banks particularly in the US.

The five major Canadian banks trading on the US markets are listed below with their current dividend yields:

1.Company: Bank of Nova Scotia (BNS)
Current Dividend Yield: 4.65%
Sector: Banking

2.Company: Bank of Montreal (BMO)
Current Dividend Yield: 4.31%
Sector: Banking

3.Company: Canadian Imperial Bank of Commerce (CM)
Current Dividend Yield: 4.68%
Sector: Banking

4.Company: Royal Bank of Canada (RY)
Current Dividend Yield: 4.36%
Sector: Banking

5.Company: Toronto-Dominion Bank (TD)
Current Dividend Yield: 3.94%
Sector: Banking

Note: Dividend yields noted above are as of May 10, 2016. Data is known to be accurate from sources used.Please use your own due diligence before making any investment decisions.

Disclosure; Long all five banks

Tax Avoidance by Corporate Firms Costs the U.S. Billions in Lost Revenue Each Year

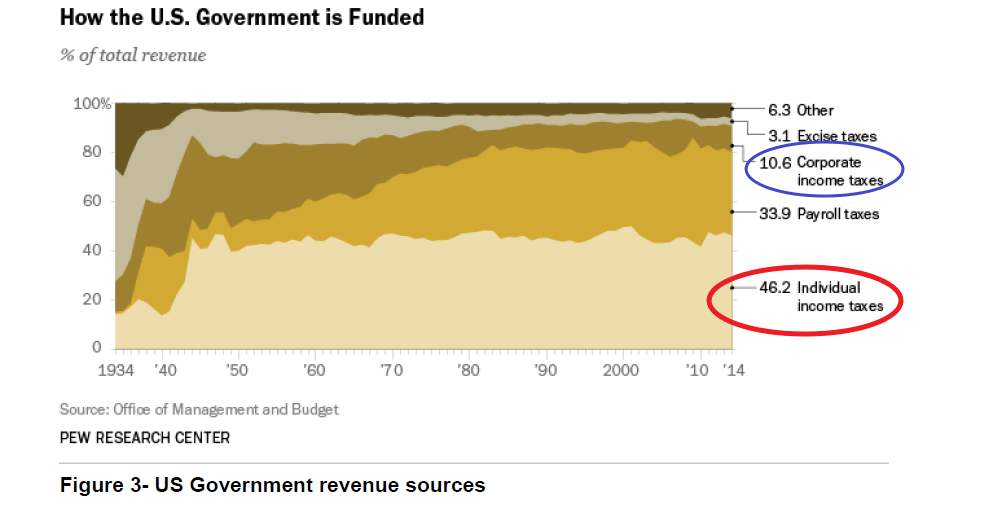
Tax avoidance by large US firms is a major issue that gets very little attention in the media. Heavy lobbying (lobbying is legal, bribing is illegal) by these firms ensures that the regulators and politicians perpetually turns a blind eye to the issue. Every year billions of dollars in taxes owed never reach the state’s coffers as corporations use all legally available options to avoid them. Since billions are unpaid the state collects these amounts from individuals to compensate for the loss. Hence individuals pay a much higher rate in taxes to the government than corporations. Some of the tax evasion strategies that are perfectly legal have funny names like Double Irish, Dutch Sandwich, etc.

Here are three interesting charts and key points from a report titled “Broken at the Top ” by Oxfam America:

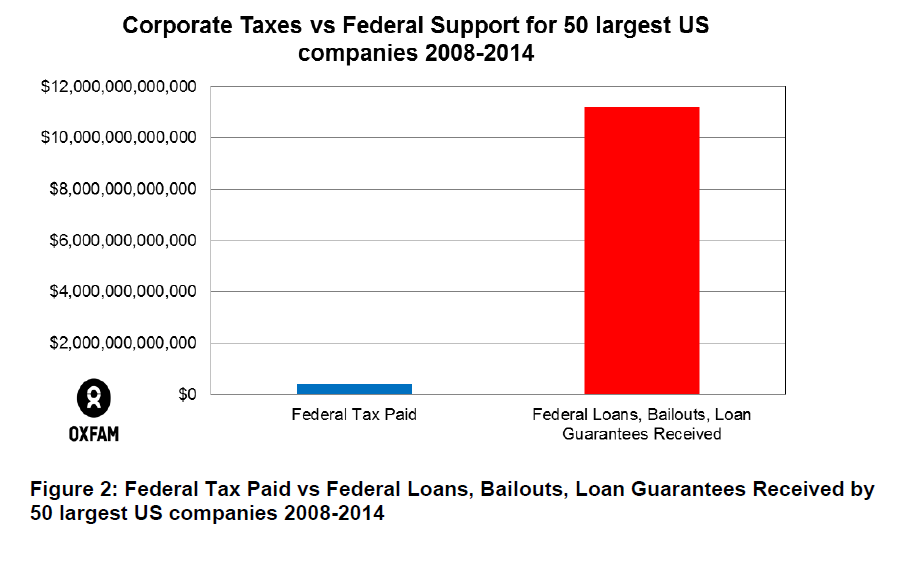
From 2008 – 2014 the 50 largest US companies collectively received $27 in federal loans, loan guarantees and bailouts for every $1 they paid in federal taxes.

From 2008 – 2014 these 50 companies spent approximately$2.6 billion on lobbying while receiving nearly $11.2 trillion in federal loans, loan guarantees and bailouts.7

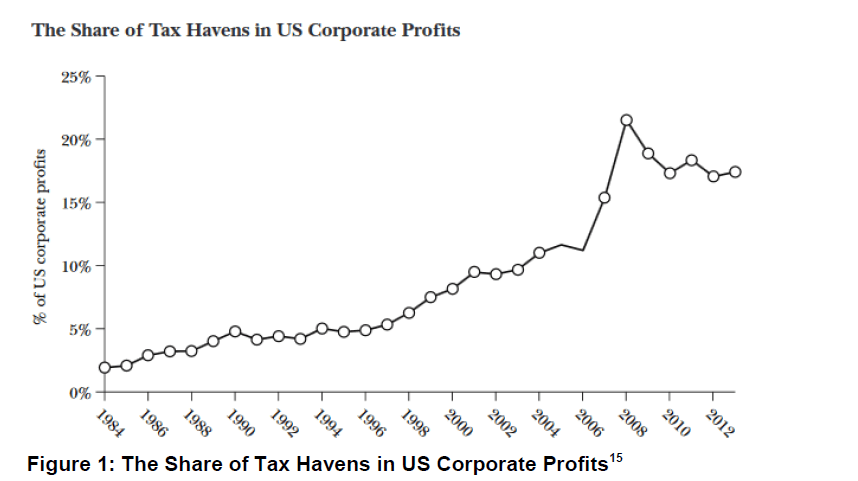
Even as these 50 companies earned nearly $4 trillion in profits globally from 2008 –2014, they used offshore tax havens to lower their effective overall tax rate to just 26.5%8, well below the statutory rate of 35% and even below average levels paid in other developed countries. Only 5 of 50 companies paid the full 35% corporate tax rate.

These companies relied on an opaque and secretive network of more than 1600 disclosed subsidiaries in tax havens to stash about $1.4 trillion offshore. In addition to the 1600 known subsidiaries, the companies may have failed to disclose thousands of additional subsidiaries to the Securities and Exchange Commission because of weak reporting requirements.

Their lobbying appears to have offered an incredible return on investment. For every $1 spent on lobbying, these 50 companies collectively received $130 in tax breaks and more than $4,000 in federal loans, loan guarantees and bailouts.

a) Share of tax Haven in US Corporate Profits:

Click to enlarge

Share of Profit in Tax Havens

b) Corporate taxes vs Federal Support:

Corporate taxes vs Federal Support Received

c) Sources of Revenue for US government:

How US Government Funded

Source: Broken at the Top – How America’s dysfunctional tax system costs billions in corporate tax dodging, Oxfam America

Comparing the Performance of Australian and Canadian Stocks

The economies of Australia and Canada are similar in many ways. For instance,both are resource-based economies. While Australia is dependent on China for the export of minerals such as iron ore Canada is the largest trading partner of the US and exports natural resources like Crude Oil, Natural Gas, Timber, etc, to the US. I wrote an article many years ago comparing the economies of Australia and Canada.

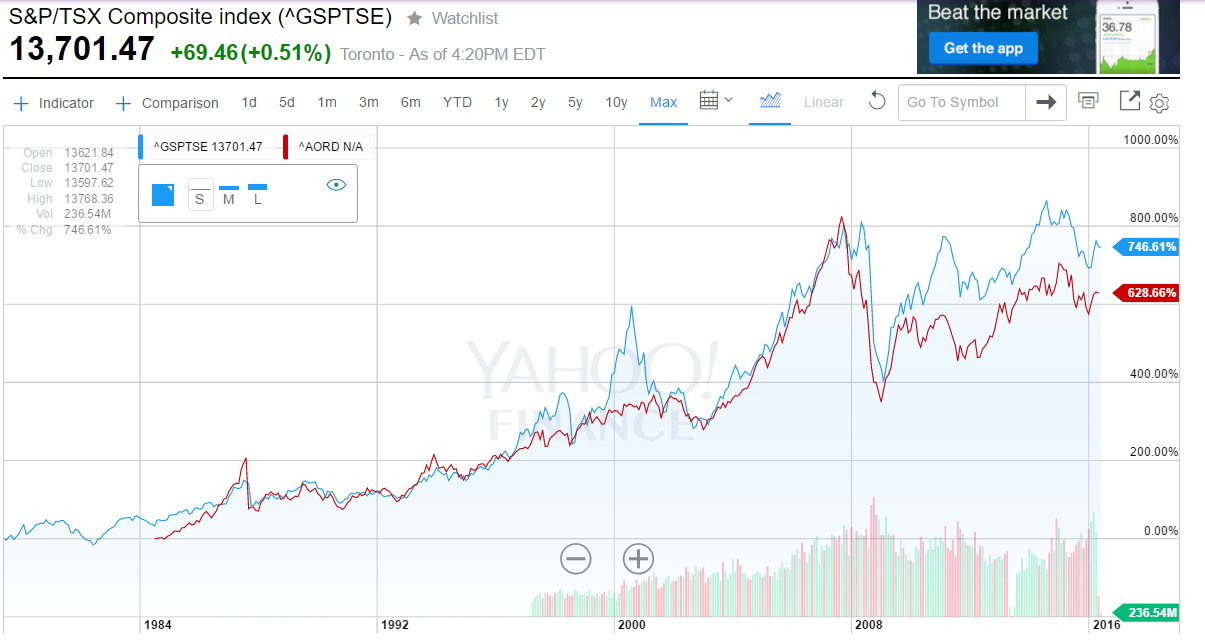
Therefore it is not surprising that the equity markets of these countries tend to follow each other. The following chart shows the long-term returns of the S&P/ASX All Ordinaries Index of Australia and S&P/TSX Composite Index of Canada:

Click to enlarge

Australia vs Canada stock returns

Source: Yahoo Finance

Canada has a large manufacturing sector compared to Australia. Auto manufacturing is a huge industry especially in the province of Ontario.

Related ETFs:

  • iShares MSCI Canada Index Fund (EWC)
  • iShares MSCI Australia Index Fund (EWA)

Disclosure: No Positions