Dividend Payout Ratio of U.S. vs European Stocks

U.S. firms are paying out more of their earnings in dividends to shareholders than investing in R&D or growing their businesses according to a report in the journal today. Though the dividend yield of the S&P 500 has stayed around 2% for many years, the payout ratio has increased in recent years to record levels.

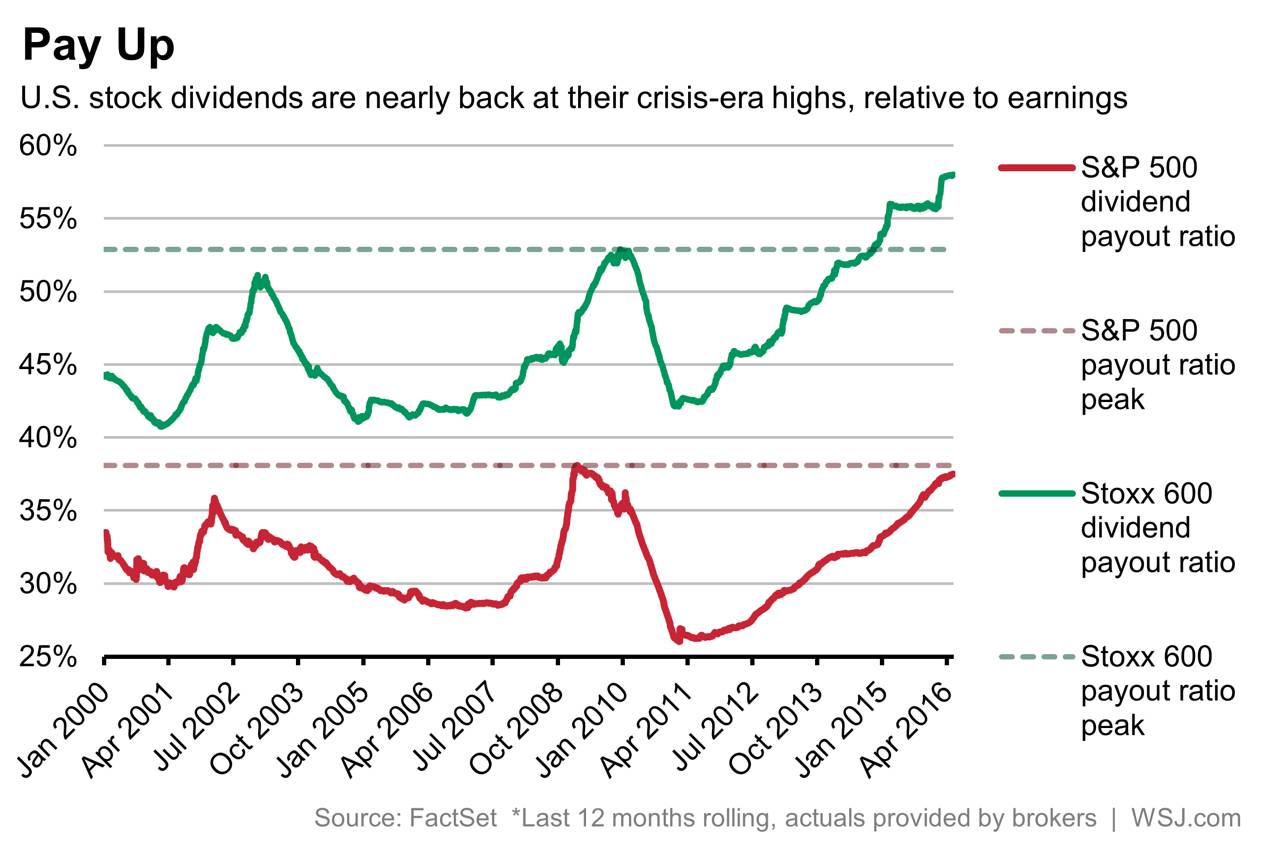
The following chart shows the dividend payout ratio of S&P 500 against European stocks as measured by the Stoxx 600 index:

Click to enlarge

US vs European Dividend Payout Ratio

From the news report:

S&P 500 companies have paid out 37.5% of their earnings in dividends over the past 12 months, just a fraction below the 38.1% recorded in 2009, when earnings were plunging during the depths of the financial crisis.

In Europe, the payout ratio surpassed financial crisis levels in late 2014. The Stoxx 600′s payout ratio is now at 58%. Part of the difference between the U.S. and European ratios is down to a preference for share buybacks in the U.S.

Source: Fund Managers Sour on Dividend Boom as U.S. Payouts Climb Towards New Record, WSJ, May 18, 2016

Many U.S. firms generally prefer to buy back their own shares than pay out cash in the form of dividends to shareholders. European companies prefer to payout dividends than share buybacks.

Also checkout:
The 10 Biggest Binational Migrant Flows 2010-2015

Migration is a major issue globally. In the past few years the mass migration of people from the Middle East and Africa into Europe has become a major headline news for the media and politicians alike.

Sometimes migration from one specific country to another tend to be very high for a variety of reasons. For instance it could be due to the reason that the two countries are neighbors such as Mexico and the US and the strong economic, political, cultural links between them.

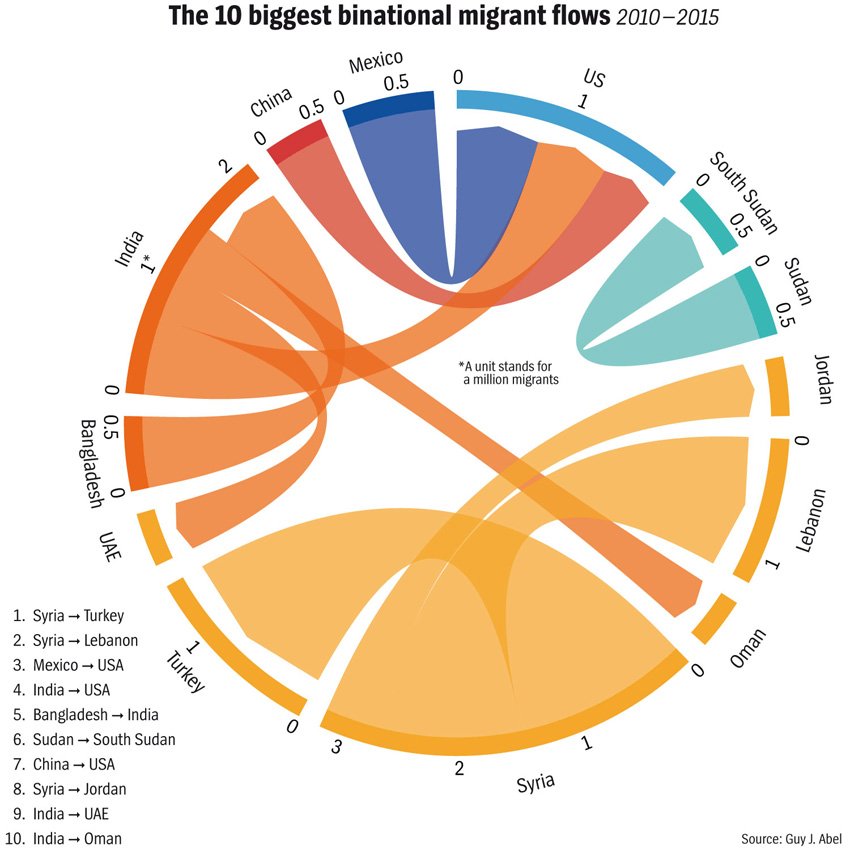
The following neat graphic shows the 10  biggest binational migration flows during 2010-2015:

Click to enlarge

Top 10 binational migrant flows 2010-2015

Source: Global Migration? Actually, The World Is Staying Home, Der Speigel

The three top source countries for migrants into the US are Mexico, India and China.

31 Foreign Stocks With Large Market Capitalization on the NYSE

The following foreign companies resulted from a stock screen for firms with > $50.0 billion market cap on the NYSE::

NameSymbolMarket CapitalizationIndustryDividend Yield
 China Mobile Ltd. (ADR)CHL $227.7B Wireless Telecommunication Services 4.76%
 Alibaba Group Holding LtdBABA $200.5B Internet & Catalog Retail --
 Anheuser Busch Inbev SA (ADR)BUD $203.3B Beverages 3.17%
 Novartis AG (ADR)NVS $197.2B Pharmaceuticals 3.59%
 Toyota Motor Corp (ADR)TM $172.1B Automobiles 3.61%
 HSBC Holdings plc (ADR)HSBC $123.3B Banks 9.78%
 Taiwan Semiconductor Mfg. Co. Ltd. (ADR)TSM $117.2B Semiconductors & Semiconductor Equipment 3.13%
 Total SA (ADR)TOT $120.8B Oil, Gas & Consumable Fuels 5.55%
 Royal Dutch Shell plc (ADR)RDS.A $201.6B Oil, Gas & Consumable Fuels 7.37%
 Novo Nordisk A/S (ADR)NVO $110.2B Pharmaceuticals 1.75%
 Sanofi SA (ADR)SNY $103.4B Pharmaceuticals 4.11%
 GlaxoSmithKline plc (ADR)GSK $103.8B Pharmaceuticals 5.52%
 BP plc (ADR)BP $97.3B Oil, Gas & Consumable Fuels 7.49%
 Nippon Telegraph & Telephone Corp (ADR)NTT $99.2B Diversified Telecommunication Services 1.67%
 NTT Docomo Inc (ADR)DCM $102.4B Wireless Telecommunication Services 2.21%
 SAP SE (ADR)SAP $95.7B Software 1.57%
 Westpac Banking Corp (ADR)WBK $76.9B Banks 6.34%
 AstraZeneca plc (ADR)AZN $71.8B Pharmaceuticals 4.86%
 Lloyds Banking Group PLC (ADR)LYG $67.7B Banks 3.31%
 Diageo plc (ADR)DEO $68.5B Beverages 3.12%
 Banco Santander, S.A. (ADR)SAN $66.6B Banks 4.81%
 Mitsubishi UFJ Financial Group Inc (ADR)MTU $65.8B Banks 3.21%
 Unilever plc (ADR)UL $134.9B Food Products 3.61%
 Unilever N.V. (ADR)UN $134.9B Food Products 3.70%
 Eni SpA (ADR)E $55.5B Oil, Gas & Consumable Fuels 5.77%
 National Grid plc (ADR)NGG $54.0B Multi-Utilities 4.52%
 HDFC Bank Limited (ADR)HDB $43.3B Banks 0.58%
 CNOOC Ltd (ADR)CEO $51.7B Oil, Gas & Consumable Fuels 5.48%
 Statoil ASA(ADR)STO $52.4B Oil, Gas & Consumable Fuels 6.72%
 Teva Pharmaceutical Industries Ltd (ADR)TEVA $54.2B Pharmaceuticals 2.70%
 Telefonica S.A. (ADR)TEF $52.6B Diversified Telecommunication Services 7.24%

Due to the collapse in oil prices, oil firms do not lead with huge market caps. China-based mobile operate China Mobile has the largest market cap followed by alcoholic beverage maker  Anheuser Busch Inbev SA.

Germany’s Major Trade Partners 2015

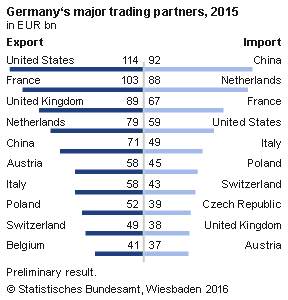
The U.S. was Germany’s largest trading partner in 2015 according to a report by De Statis. The major trading partners of Germany in 2015 are shown in the chart below:

Click to enlarge

Germany - Trading Partners 2015

Source:De Statis

Goods worth 173.2 billion euros in exports and imports were traded between Germany and USA. The next major trade partner was France followed by UK and The Netherlands.

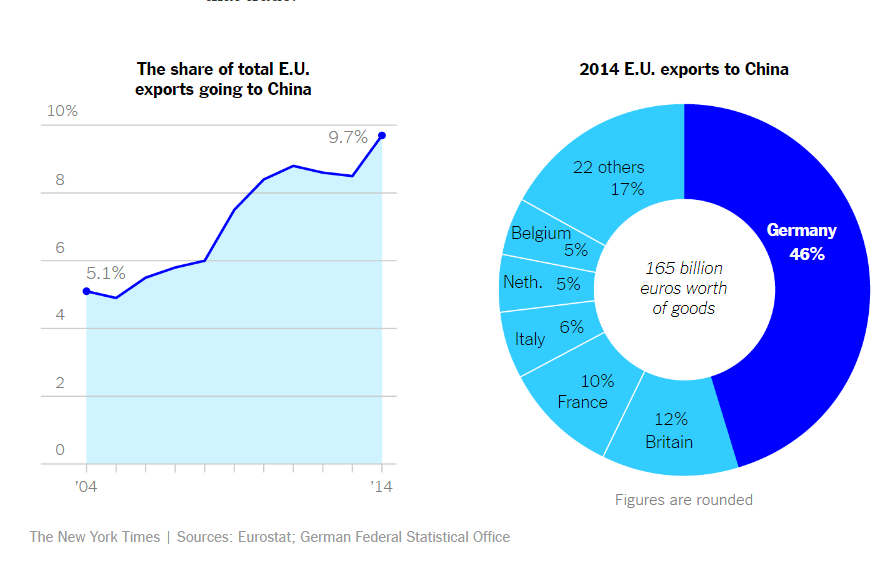
China was the 5th major trade partner for Germany. Good worth about 71 billion Euros were exported to China. On the import side, China was the top country for imports into Germany.

Of the E.U. exports to China, Germany accounts for nearly half of the trade. The biggest exports to China from Germany are automobiles.

Eu Exports to China 2014

Source: Why Germany Slips When China Swoons, NY Times

Five Growth Stocks To Consider For Potential Investment

Growth stocks tend to have lower dividend payouts and are known for their growth potential. Unlike dividend stocks which are held for solid, consistent and growing income with some price appreciation over time, growth stocks offer investors to gain from substantial gains as they deploy excess earnings on growing the firm which can be either by growing organically or by acquisitions.

I have written many times about the need to own dividend stocks in a diversified portfolio. While dividend payers are important to hold, it is also wise to allocate some portion of a portfolio to growth stocks as they have the ability to boost the overall portfolio return. Growth-oriented companies can be found in many sectors such as social media, e-commerce, fast-casual dining, auto, chemicals, clothing, etc. In this post, let us take a look at five growth stocks for consideration.

1. Novo Nordisk A/S (NVO)

Denmark-based healthcare firm Novo Nordisk is the world’s leader in the diabetes market. Currently it has a P/E of 26 compared to the industry’s 30. The current market cap is $106.0 billion putting the firm squarely as in the large-cap segment. International growth especially in China offers tremendous scope for growth.

A short profile of the firm:

The Company is engaged in discovery, development, manufacturing and marketing of pharmaceutical products. The Company’s business segments include diabetes and obesity care, and biopharmaceuticals. The diabetes and obesity care segment covers insulins, glucagon-like peptide-1 (GLP-1), other protein-related products (such as glucagon, protein-related delivery systems and needles), oral anti-diabetic drugs and obesity. The biopharmaceuticals segment covers the therapy areas of hemophilia care, growth hormone therapy and hormone replacement therapy. It offers a range of diabetes product, including new generation insulins and a portfolio of modern insulin. It provides Saxenda, which is a product to treat obesity and is available in Denmark, Italy and Canada. Its other products/compounds include Xultophy, Semaglutide (NN9535), Faster-acting insulin aspart (NN1218), N9-GP (NN7999), N8-GP (NN7088) and NN8640 Once-weekly human growth hormone.

2. Magna International Inc (MGA)

Canadian auto-parts maker is trading at attractive valuation with a P/E of just over 8.0 relative to the industry average of 36.0. The current dividend yield is 2.50% and the market cap is about $16 billion. There are rumors in the German press that Magna could produce Apple (AAPL) car in Austria as the firm has auto manufacturing facilities there.

Profile of Magna:

The Company’s segments are North America, Europe, Asia, Rest of World, and Corporate and Other. Its product capabilities include producing body, chassis, exterior, seating, powertrain, electronic, vision, closure, and roof systems and modules, as well as vehicle engineering and contract manufacturing. The Company has over 290 manufacturing operations and over 80 product development, engineering and sales centers in approximately 30 countries. The Company’s operating unit, Cosma International, is an automotive supplier that provides a range of body, chassis and engineering solutions. The Company produces a range of body-in-white solutions.

3. Continental AG (CTTAY)

Continental is one of Magna’s competitors and is also a constituent in Germany’s benchmark DAX Index. The current P/E is just over 13.0.

Profile:

Continental AG (Continental) is a global automotive supplier, tire manufacturer and industrial partner to other industries. Continental operates through six segments: Chassis & Safety, Powertrain, Interior, Tires, ContiTech and Other/consolidation. The Chassis & Safety segment focuses on technologies for active and passive safety, and for vehicle dynamics. The Powertrain segment integrates system solutions for powertrains in vehicles of various classes. The Interior segment specializes in information management in vehicles. The Tires segment offers a range of tires, from tires for cars, trucks and buses to specialist products for construction and industrial vehicles to tires for bicycles and motorcycles. The ContiTech segment combines Continental’s rubber and plastics activities for various industries. The Other/consolidation segment consists of centrally managed subsidiaries and affiliates, as well as the holding function of Continental and certain effects of consolidation.

4. LyondellBasell Industries NV (LYB)

LyondellBasell Industries is a global specialty chemical company. Last week the company announced a dividend increase of 9% and a share buyback up to 10% of its shares.

Profile:

LyondellBasell Industries N.V. is a global chemical company. The Company’s segments include Olefins and Polyolefins-Americas (O&P-Americas), Olefins and Polyolefins-Europe, Asia, International (O&P-EAI), Intermediates and Derivatives (I&D), Refining, and Technology. Its O&P-Americas segment produces and markets olefins, including ethylene and ethylene co-products, and polyolefins. Its O&P-EAI segment produces and markets olefins, including ethylene and ethylene co-products, polyolefins and specialty products, including polybutene-1 and polypropylene compounds. Its I&D segment produces and markets propylene oxide and its co-products and derivatives, acetyls, including methanol, and ethylene oxide and its derivatives. Its Refining segment refines high-sulfur crude oil and other crude oils, including gasoline and distillates. Its Technology segment develops and licenses chemical, polyolefin and other process technologies, and also develops, manufactures and sells polyolefin catalysts.

5. Autozone Inc (AZO)

US-based Autozone is a classic growth stock. The company does not a pay a dividend at all. However the stock has enjoyed exponential growth over the years. Auto parts retailers are excellent long-term investments since consumers tend to buy auto parts during economic expansions and contractions. During recessions consumers prefer to maintain their existing cars and buy the parts needed to keep the old cars running. In boom times, consumers buy replacement parts when they have to replaced such as batteries.

Profile:

AutoZone, Inc. is a retailer and distributor of automotive replacement parts and accessories in the United States. The Company’s operating segments include Auto Parts Locations and Other. The Auto Parts Locations segment comprises Domestic Auto Parts, Mexico, Brazil and Interamerican Motor Corporation (IMC). The Other segment reflects business activities of three businesses: ALLDATA, E-commerce and AutoAnything. As of August 29, 2015, the Company operated approximately 5,140 AutoZone stores in the United States, including Puerto Rico; over 440 stores in Mexico; approximately seven stores in Brazil, and over 20 IMC branches. The Company’s store carries a product line for cars, sport utility vehicles, vans and light trucks, including new and remanufactured automotive hard parts, maintenance items, accessories and non-automotive products. As of August 29, 2015, in approximately 4,140 of its domestic AutoZone stores, the Company also provides a commercial sales program.

Disclosure: Long MGA and CTTAY