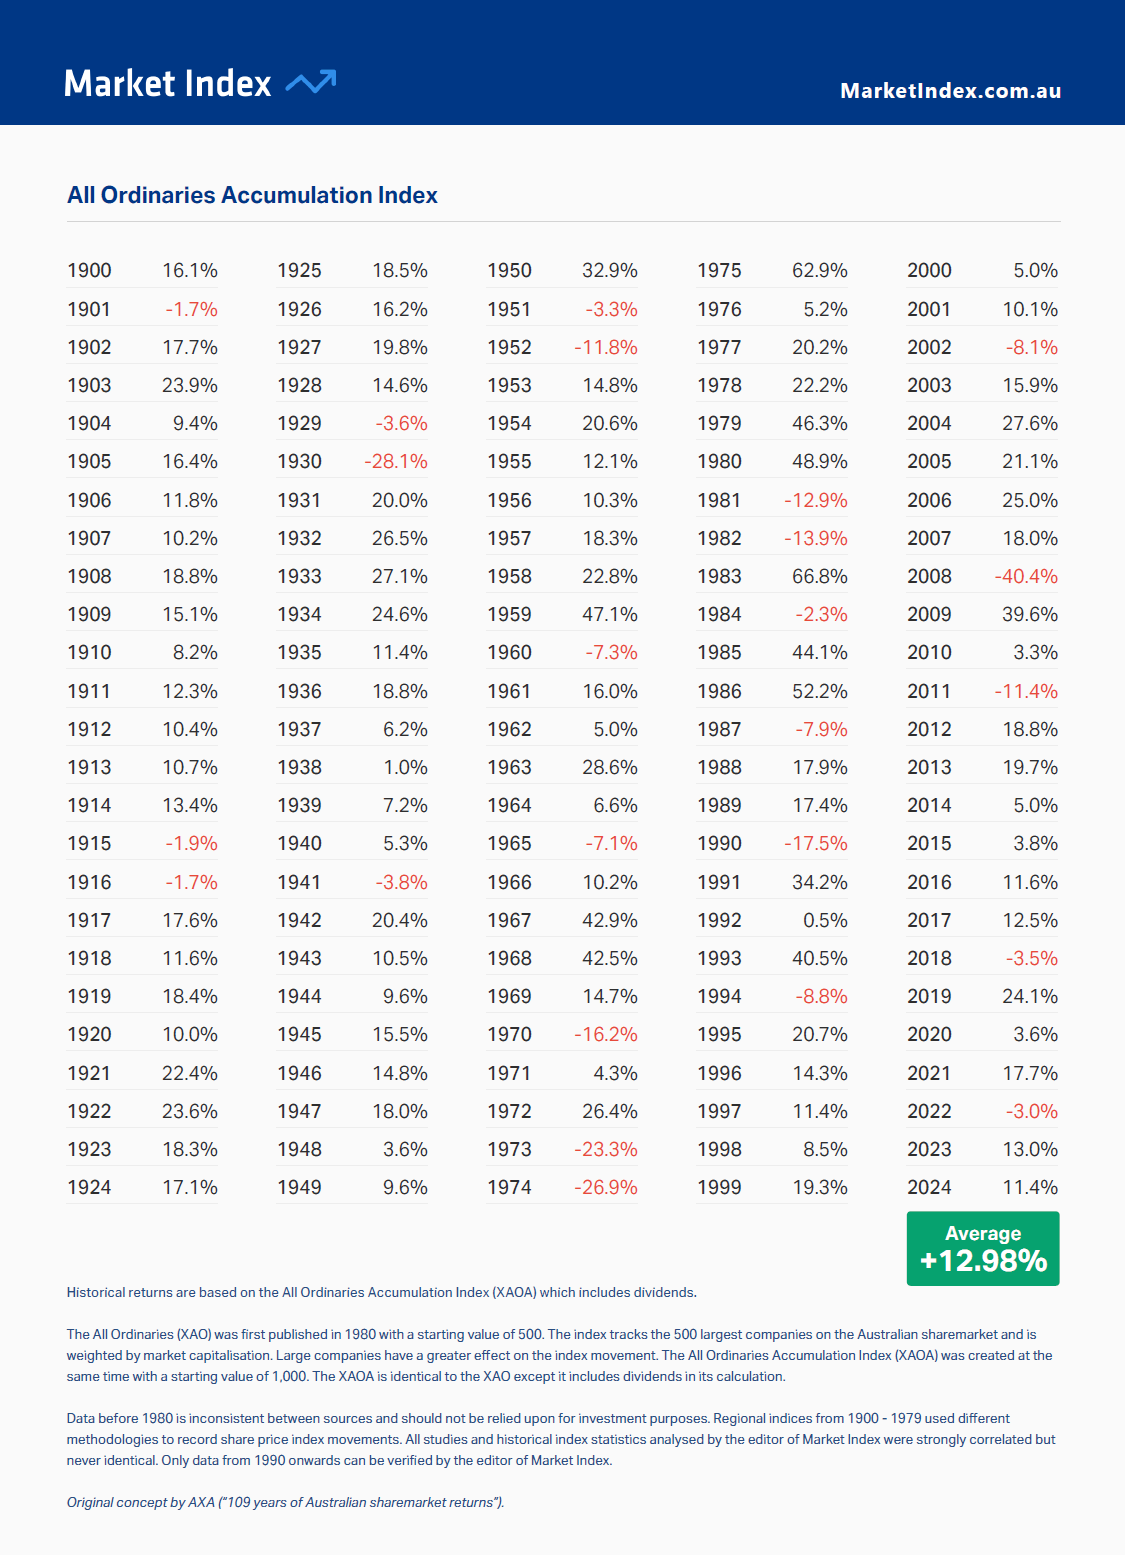
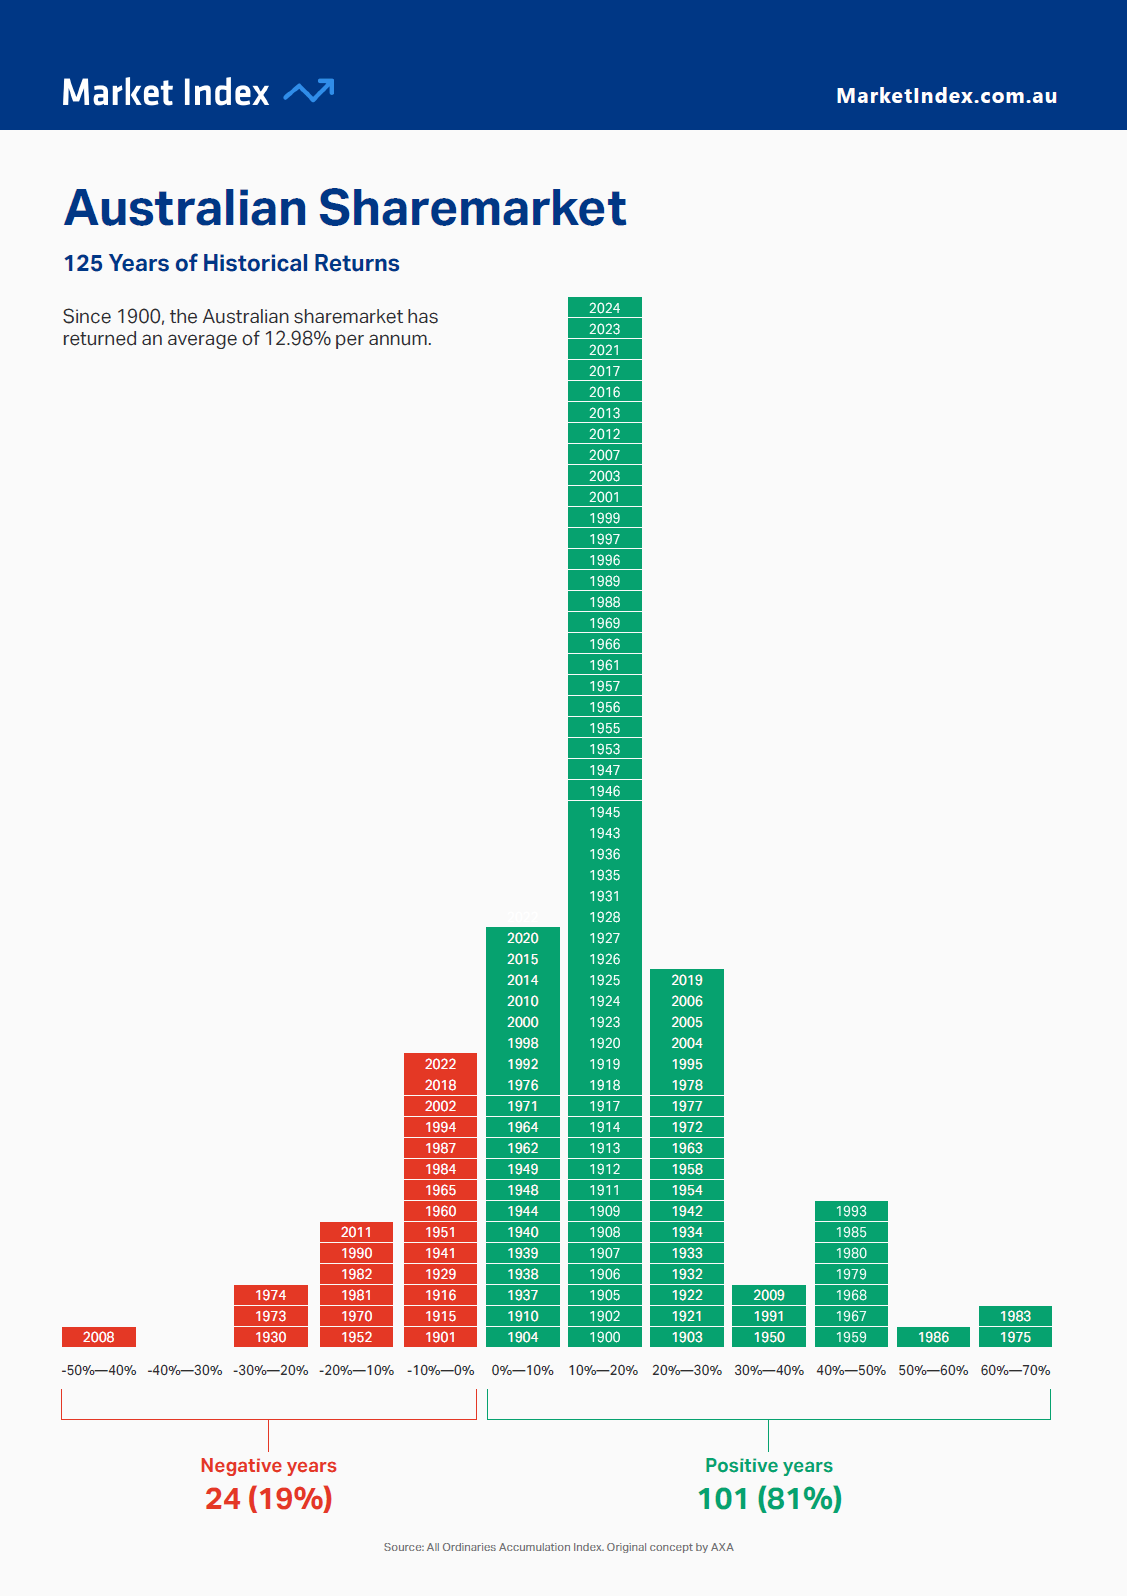
Average Annual Returns of Australian Stock Market from 1900 to 2024

Australian stocks have had an average annual return of 12.98% in the past 125 years through 2024 based on returns on the ASX All Ordinaries Accumulation index. In that time period, most of the years had a positive return. Only 24 years or 19% of the time had negative returns.

Click to enlarge
Source: Market Index Australia

Related ETFs and ADRs:

Disclosure: No positions

US vs. China Exports 2015 to 2024: Chart

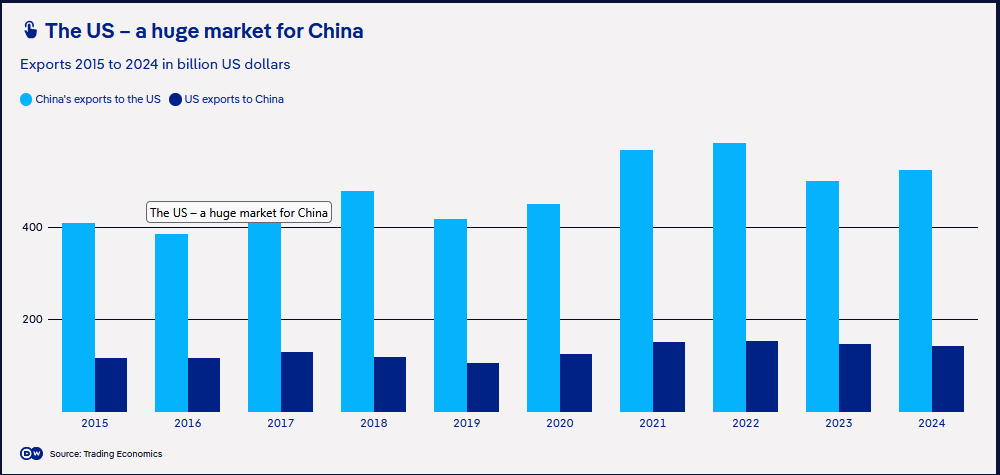
The economy of China is an export-based economy. The US and many developed countries in Europe are consumption-driven economies. China produces more than it can consume and looks to overseas markets to export its surplus production. The US for example is a major importer of goods from China. The country chronically runs a trade imbalance with China. The US exports to China is less than half of China’s exports to the US since 2015 as shown in the chart below. It remains to be seen how the 2025 data turns out due to tariffs imposed on imports.

Click to enlarge

Source: What challenges does the world economy face in 2026?, DW

In 2024, China exported $526 billion worth of goods to the US. American exports to China amounted to just $144 billion.

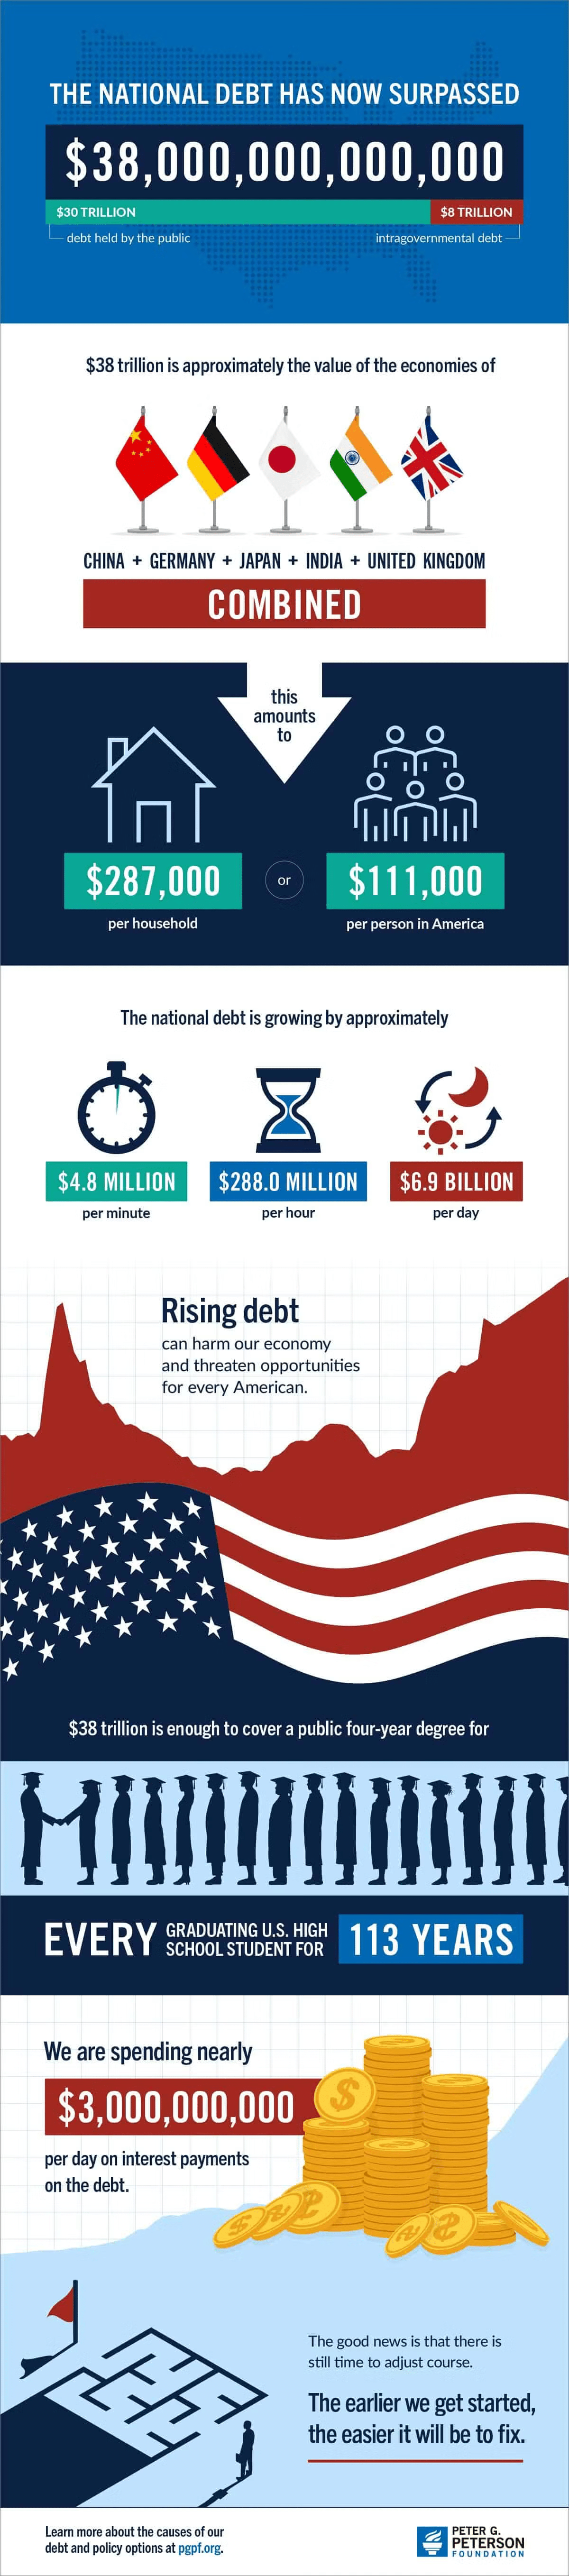
The US National Debt Surpasses $38 Trillion: Infographic

The US debt mountain continues to grow. The Gross Federal debt has crossed $38 Trillion (or)$38,000,000,000,000 according to an article at the Peter G. Peterson Foundation. Since this is a such huge amount, the following infographic puts the number in perspective in a few ways. While most this debt is held by the general public it still needs to be serviced. Hence interest payments amount to an astonishing $3.0 billion per day.

Click to enlarge

Source: Infographic: The National Debt Is Now More than $38 Trillion. What Does That Mean?, Peter G. Peterson Foundation

Dividend Withholding Tax Rates by Country for 2026: Chart

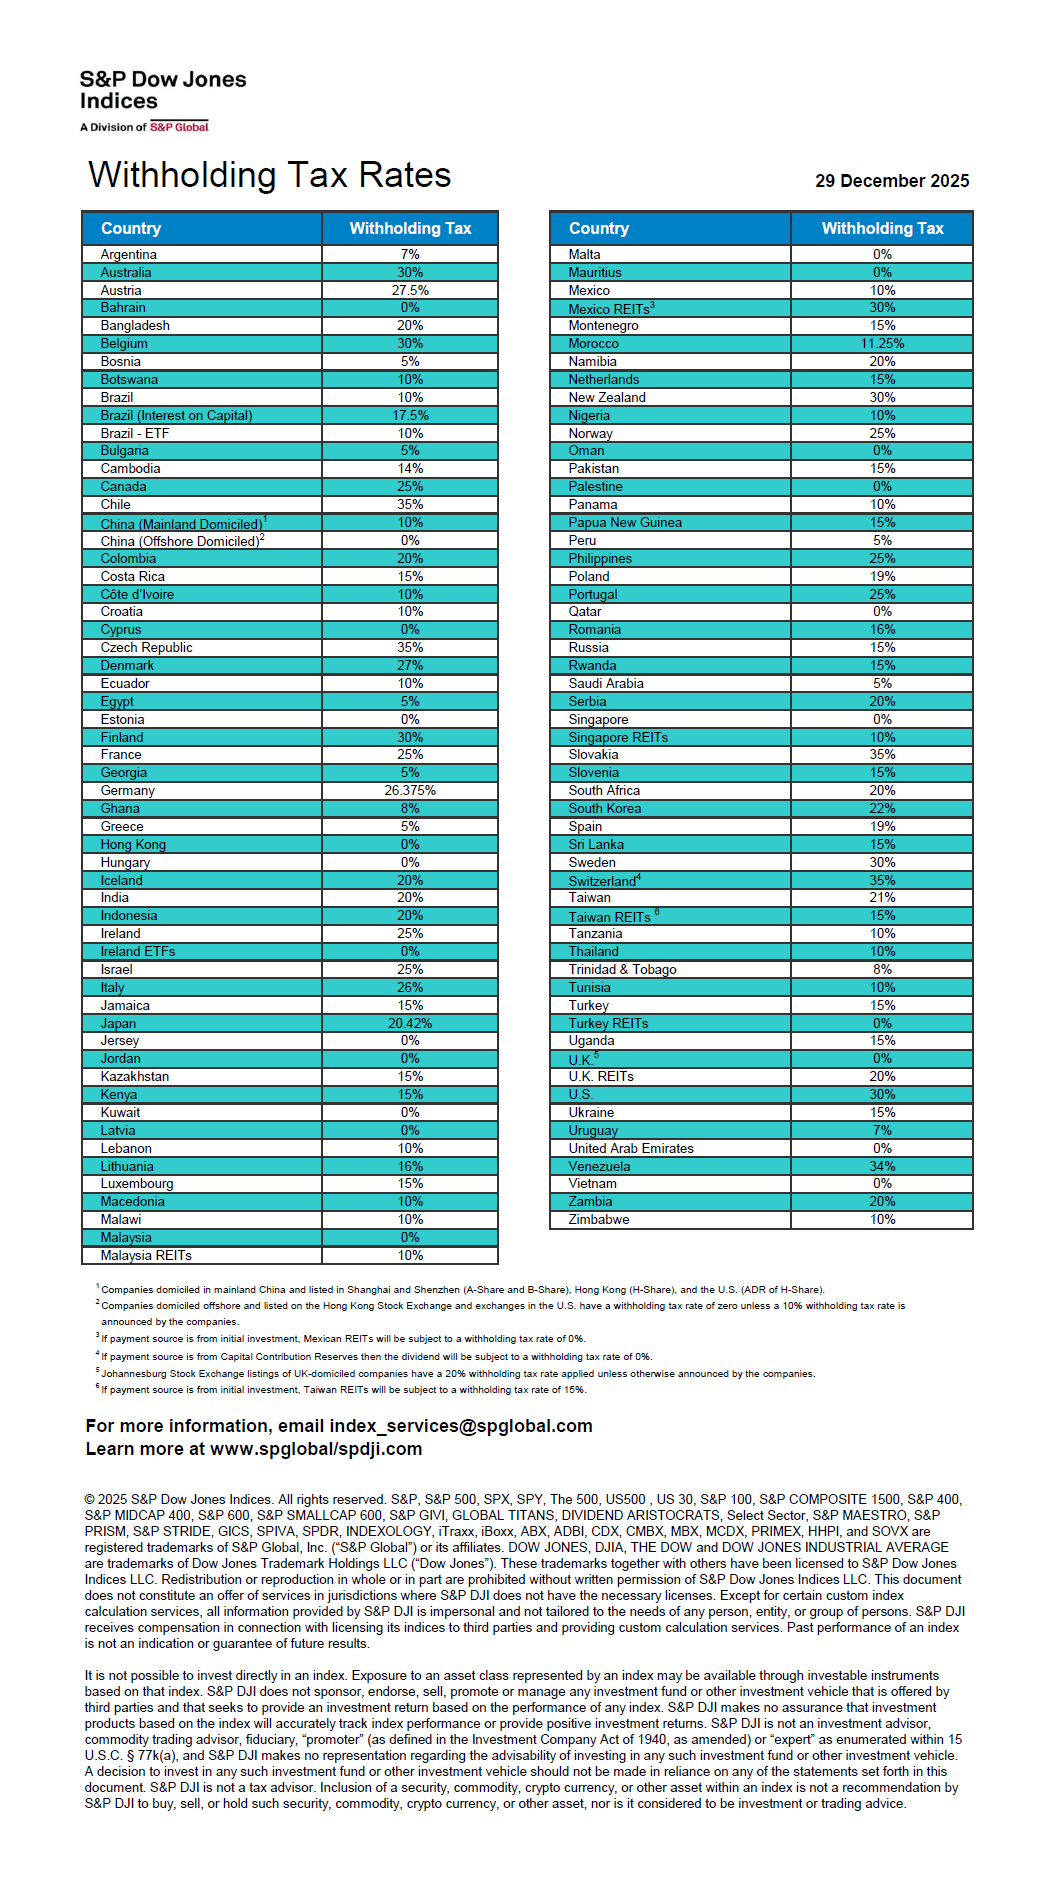
Most countries charge a withholding tax on dividends paid out by domestic companies to foreign investors. This tax can be substantial for some countries and will reduce the dividend yield. So its very important to consider the dividend withholding tax rates when picking foreign stocks. In addition to this tax, ADRs may also include other fees such as pass-through fees which we will discuss in another post later.

S&P Global has updated their one-pages on the dividend withholding taxes for 2026. This table shows the rates for each country as of Dec 29, 2025. The highest rate is 35% by countries such as Switzerland, Belgium, Chile, etc. On the other hand, some have 0% rates. For instance, Singapore charges 0% on stocks but 10% for REITs.

Canada has a 25% rate but can be reduced to 15% by submitting a form through brokers. For Canadian stocks held in US qualified retirement accounts like the IRAs there is no dividend withholding tax at all. This is a great benefit for US investors.

Click to enlarge

Source: S&P Global

Related:

An Update on the Declaration of Eligibility for Canadian Tax Treaty Benefits

Canada S&P/TSX Composite Index Annual Total Returns from 1920 to 2024: Chart

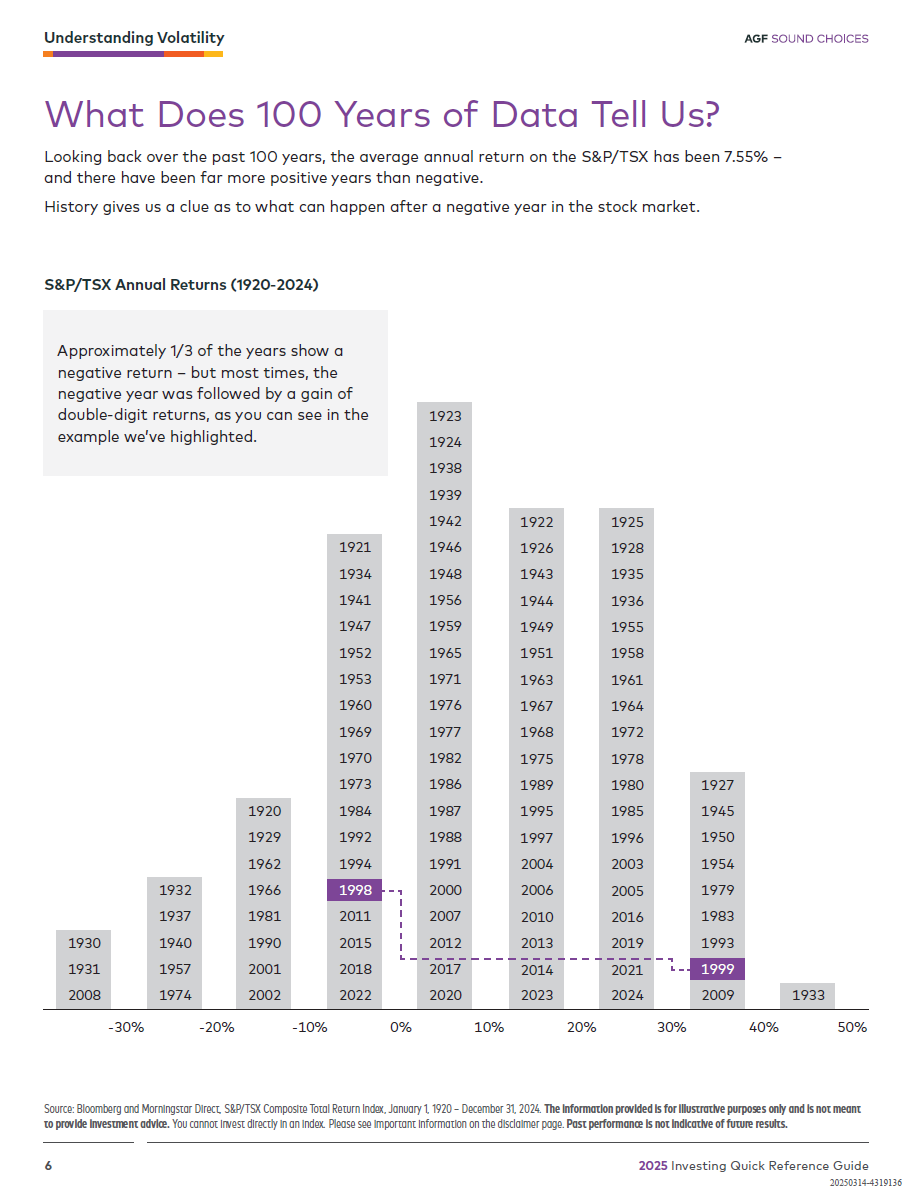
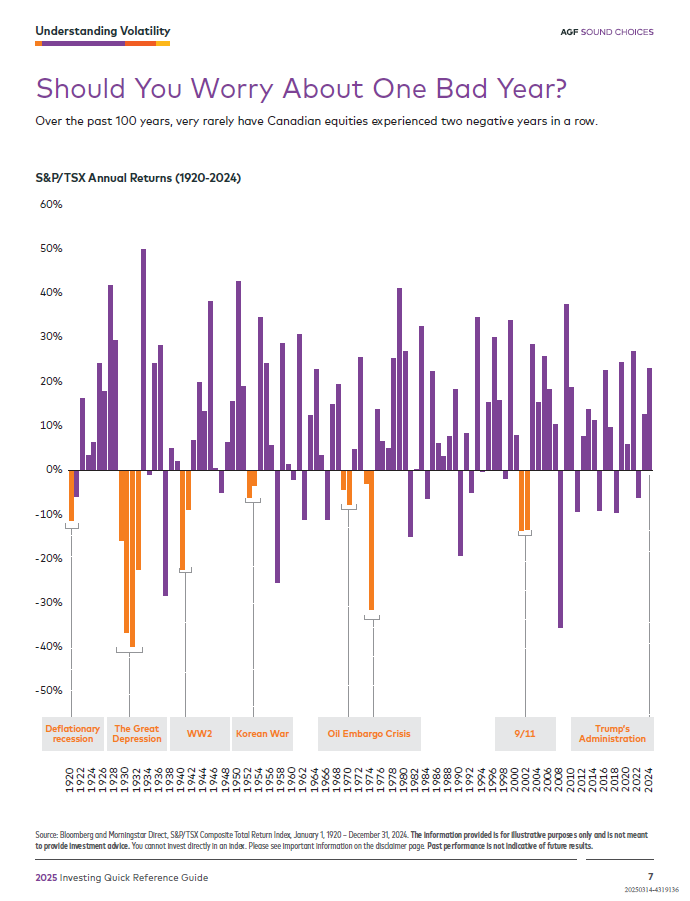
The average annual return of the Canadian equity market is 7.55% based on data over the past 100 years. As with other developed markets, in most of the years the returns were positive and when there was negative return year it was followed by positive returns. The below chart shows this pattern in the years 1998 and 1999. While 100 years is a too of a period to hold stocks for most investors, any duration measured in years or decades lead to a positive return.

Click to enlarge

Source: 2025 Quick Reference Guide, AGF

Related ETF:

  •  iShares MSCI Canada ETF (EWC)

For investors interested in individual companies, this page shows the full list of Canadian stocks trading on the US markets.

Disclosure: No positions