Some investors not have exposure to foreign companies in their portfolios because of home bias.Others may avoid investing in overseas firms due to the additional risks involved such as political risk, currency exchange risk, transparency issues, etc. For these investors there is a way to gain from the stability and growth the US consumer spending. This way can be called as “Going abroad to come home”. Basically this strategy involves investing in foreign companies that have substantial operations in the US and derive a big part of their revenues from the US.
Investing in international companies that have a major presence in the US market has many advantages. One advantage is diversification. Instead of simply owning US stocks, an investor holding foreign stocks can benefit from this diversification since the correlation between the US markets and some foreign markets can be very low. Another advantage is the potential ability to generate higher gains by owning foreign stocks. For example, US sports goods maker Nike(NKE) has had a tremendous run the past few years competitor Adidas AG(ADDYY) of Germany has soared in the past year. So an investors owing both Nike and Adidas could earn better returns than owning only Nike.
The below is an excerpt from a white paper by Jeffrey Kleintop of Charles Schwab published last year:
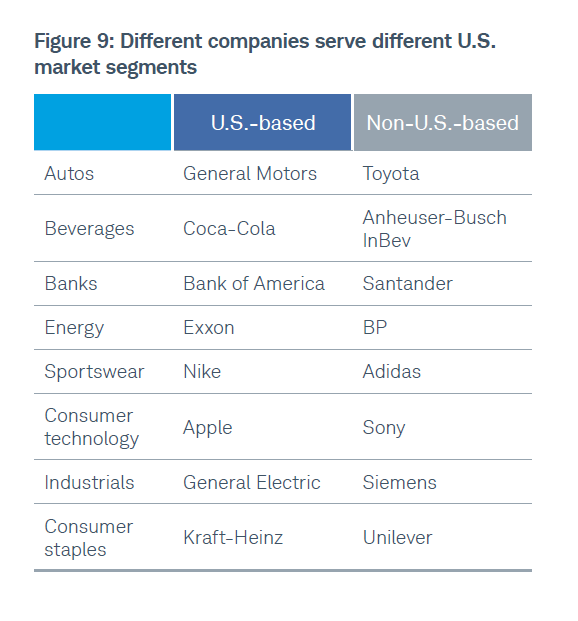
Going abroad to come home Not every company covers all the markets or products in a sector, leaving gaps in a domestic only portfolio that can result in a different magnitude of performance. U.S.-based companies do not even provide exposure to all the markets or products produced for the U.S.
Just as it is true that there are some U.S.-based companies that gain much of their revenue abroad, there are global companies that derive much of their revenue in the U.S. As you can see from the small sample of companies in Figure 9, major categories and popular brands are offered to U.S. consumers by non-U.S.-based companies.
Click to enlarge
As you can see, exposure to global companies is necessary even when seeking exposure to just the U.S. economy.
Source: The case for a global perspective, Jeffrey Kleintop, Charles Schwab
A few examples of foreign firms with big revenues from the US market include BASF(BASFY) of Germany in the chemical industry, Canadian banking giant Toronto Dominion Bank (TD), consumer staples maker Nestle (NSRGY) of Switzerland, oil major BP(BP) of the UK, etc.
The key takeaway is that by holding overseas companies with strong US revenues investors can get the best of both worlds – the benefits of owing non-US firms and at the same time profiting from the large and growing US consumer spending.
Disclosure: Long TD