European bank stocks have turned positive for the year. Since the Global Financial Crisis(GFC) of 2008-09, the Greek sovereign debt crisis and the many other crises the continent’s banks were left for dead by many investors. Unlike US banks which have recovered strongly since the crisis, European banks have been slow to implement changes necessary. However after years of enduring misery European banks may be heading for a recovery.
From a recent article in the journal:
These banks may have found a savior in Donald Trump. Investors have bet that the U.S. president-elect will embark on an infrastructure-spending binge that will send ripples across the European economy—eventually prompting the region’s central banks to raise rates. Loosening regulations, another of Mr. Trump’s pledges, would also help European banks, investors say.
Rising interest rates make banks’ basic lending business more profitable. An increase in yields on longer-term debt in global markets has already boosted financial stocks. On Thursday, bond yields were higher across the board as debt prices fell.
More buoyant banks are key for the eurozone’s economy, where extremely weak lending to businesses has held back the recovery
Goldman Sachs upgraded European banks to overweight in their asset allocation for 2017, meaning they aim to hold a larger share of them than a benchmark portfolio would suggest.
Source: Back from the Brink: European Bank Shares, WSJ, Dec 15, 2016
The following chart shows the year-to-date return of the benchmark STOXX Europe 600 Banks Index:
Click to enlarge
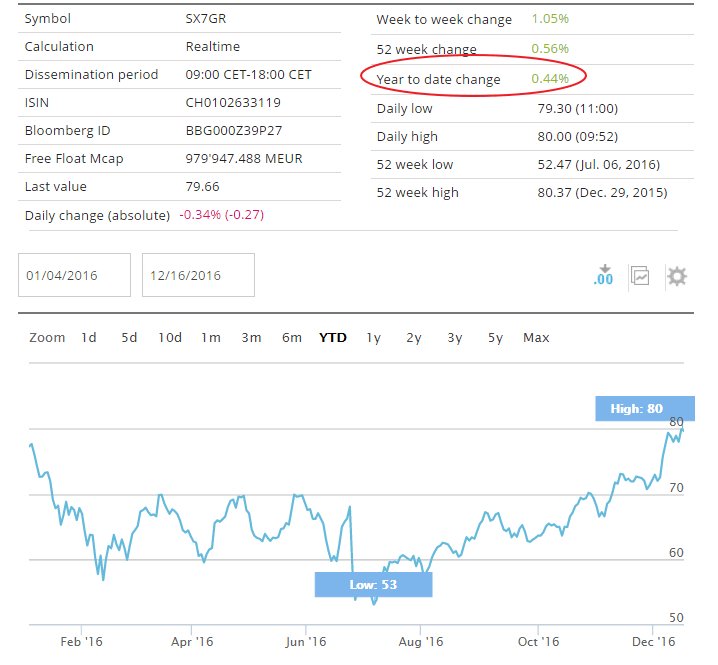
Source: STOXX
The above index holds 45 large banks from Europe including the UK. The constituents are selected based on free-float market cap.The chart below shows how European banks have lagged the overall market in the past few years:
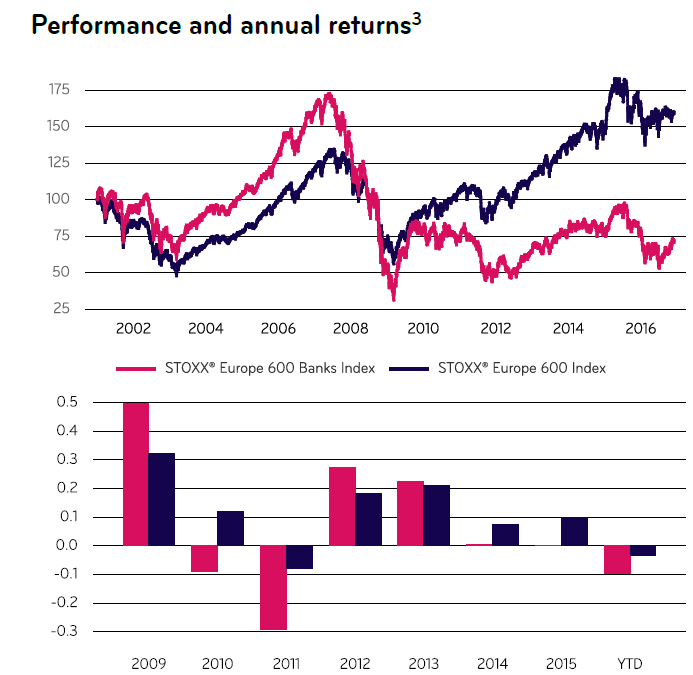
Source: STOXX
Currently the index has a trailing dividend yield of 4.1%.
From an investment perspective, though banks from Europe are showing signs of recovery investors may want to wait and see how they perform early next year. European banks still face many headwinds like the Brexit, political crisis in crisis, populist upheavals in other countries, etc.
Investors willing to add European banks can consider Scandinavian banks such as Swedbank AB (SWDBY), Svenska Handelsbanken AB (SVNLY) and Nordea Bank AB (NRBAY). ING Groep NV (ING) is a good pick among the other major banks. However US investors may want to buy it under $10 a share. The bank has recovered from around $9 a few months ago to over $14 now. British, French and German banks are best to avoid now.
Related articles on European banks you can checkout:
- It’s Time to Buy Cheap European Bank Stocks, Citigroup Says , Bloomberg, Oct 6, 2016
- Why investors are snapping up European banks after Trump victory, MarketWatch, Nov 10, 2016
- Are European Banking Stocks Cheap Enough to Buy?, Morningstar UK
- European Banks? Yes, European Banks., Investor Place
Disclosure: Long SWDBY and ING