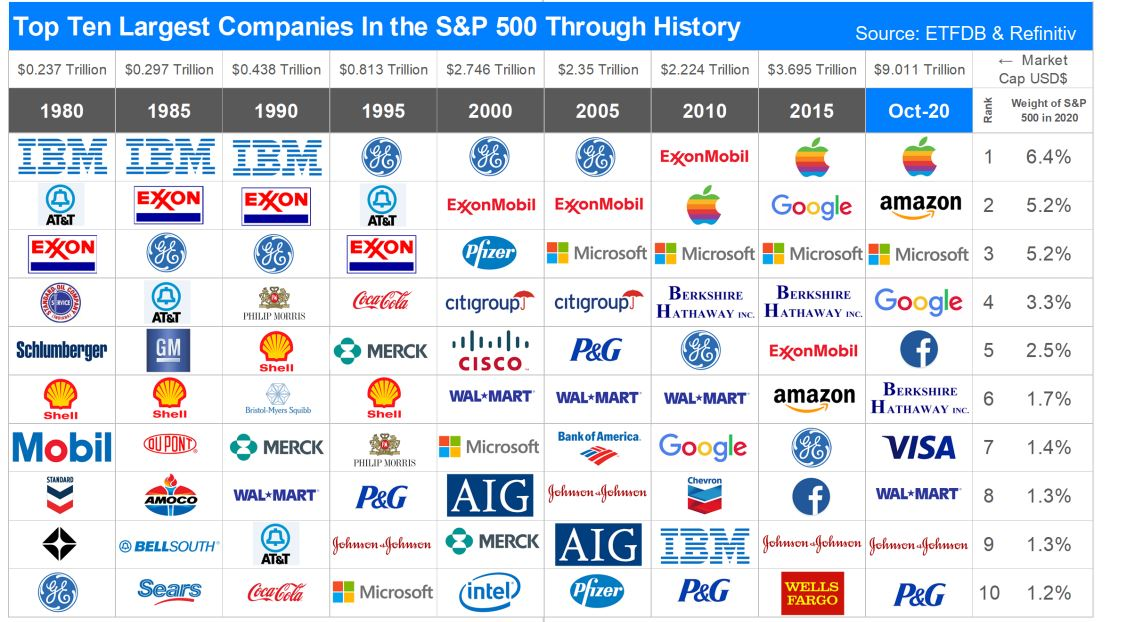
The Ten Largest Companies in the S&P 500 from 1980 to 2020: Chart

One of the main strategy for success with investing in equity markets is diversification. Companies tend to rise to the top based on the theme that is hot during a specific period. Once at the top no company stays there forever. Leadership in the S&P 500 changes on a regular basis. One time it may be the tech sector that is hot while another time it may be the good old oil or some other sector. So the important point to remember is today’s leaders could become tomorrow’s losers and vice versa. The following chart shows this concept with the leadership changes in the S&P 500 from 1980 to 2020:

Click to enlarge
Source: Lessons From Market History: Price Does Matter, Pacifica Partners

Tech giant IBM (IBM) used to be a market darling during the 80s and early 90s. That is no longer the case. IBM nowadays is just another also-run company that is still living off its former glory. Similarly who could forget about that great American wonder called the GE(GE). After a spectacular collapse the company is basically today nothing that made GE the GE. Its appliance business was taken over some Chinese firm and GE also exists but barely. Oil major ExxonMobil(XOM) appearing in this list for many years shows the importance of oil for the US economy.

The key takeaway from this post is that today’s hot stocks like Tesla(TSLA), Nvidia(NVDA), Facebook(FB), etc. could easily turn out to be duds in the years to come.

Disclosure: No positions
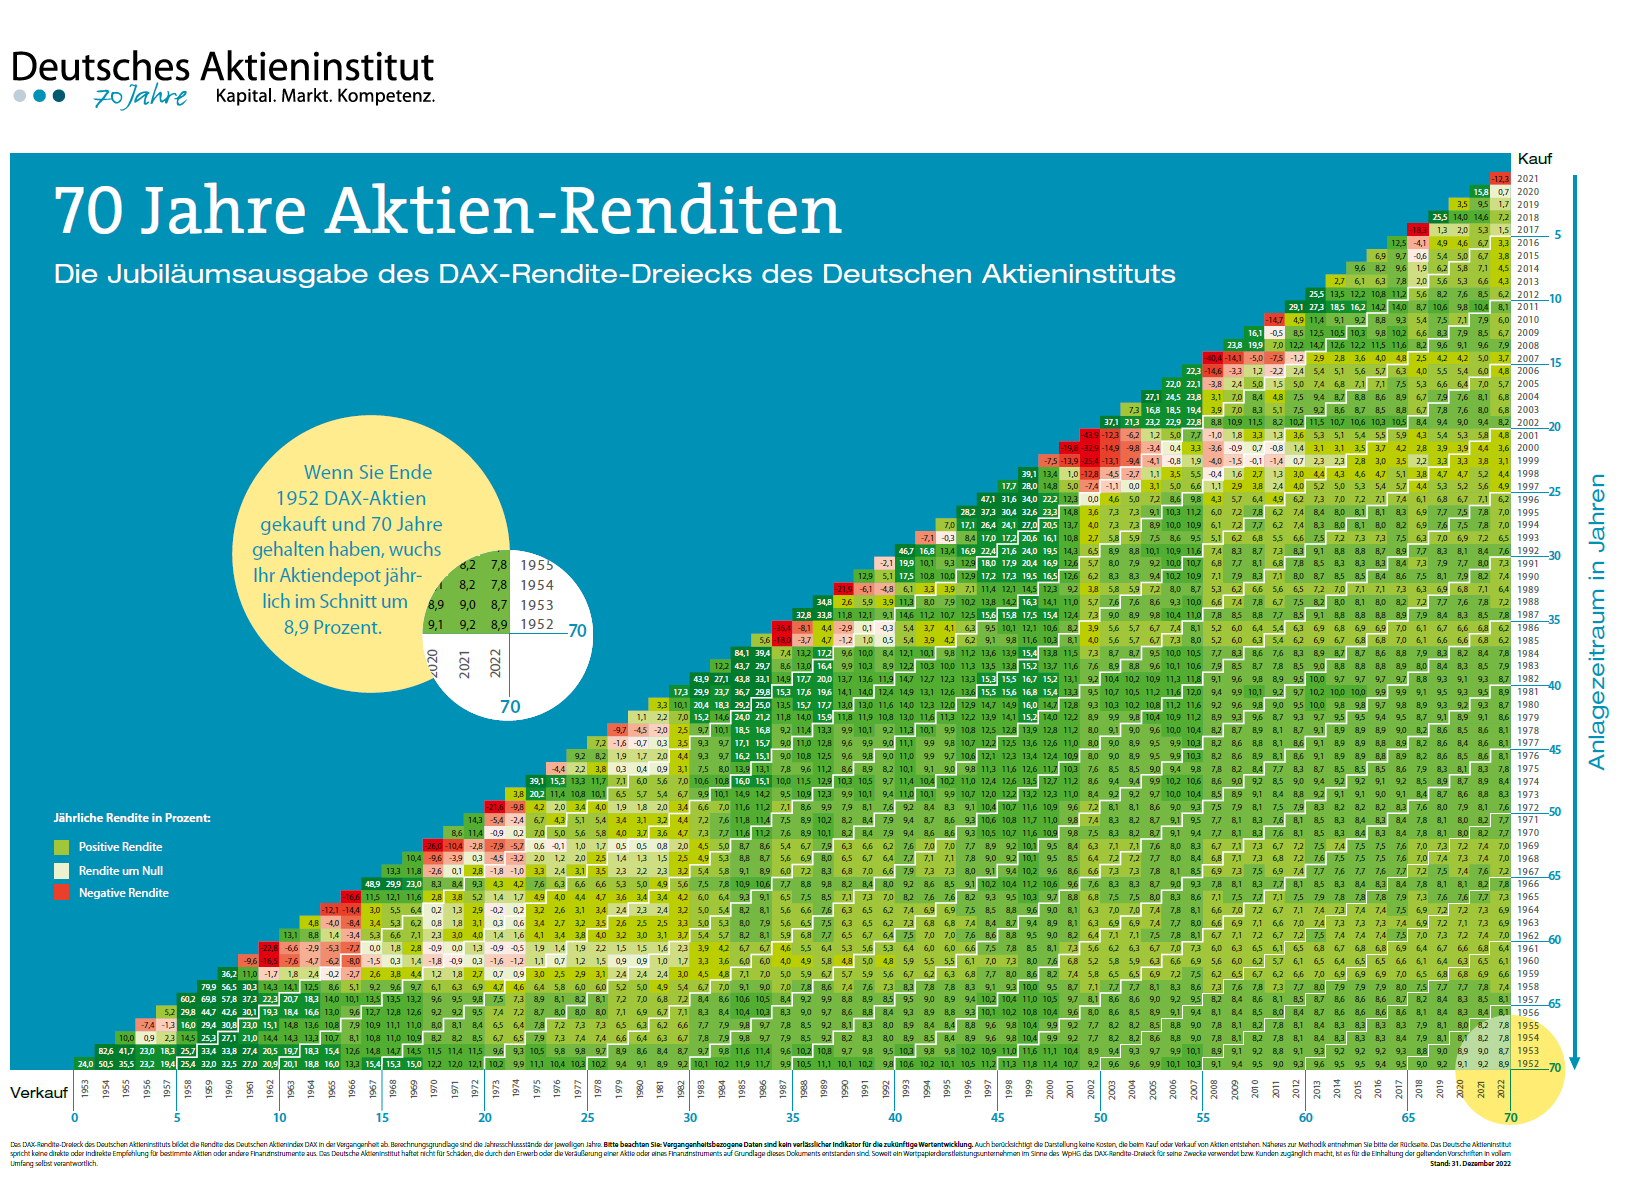
Germany’s DAX Index Returns Triangle 1953 to 2021: Chart

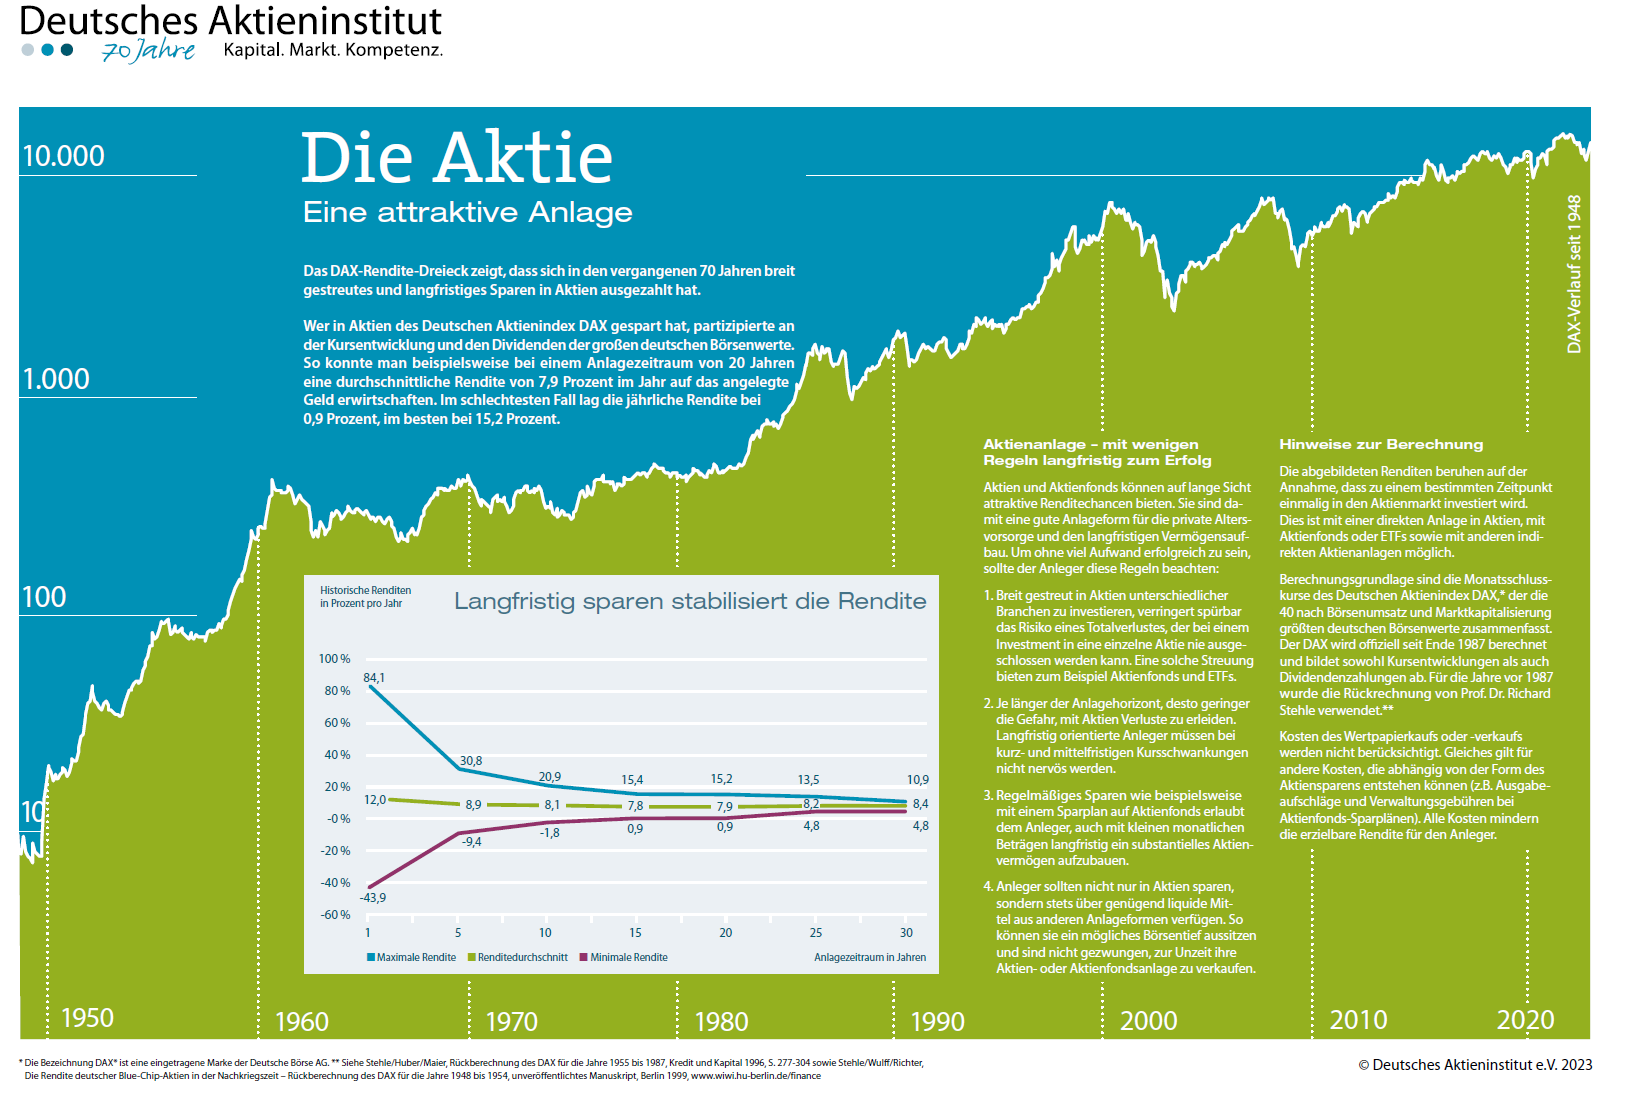
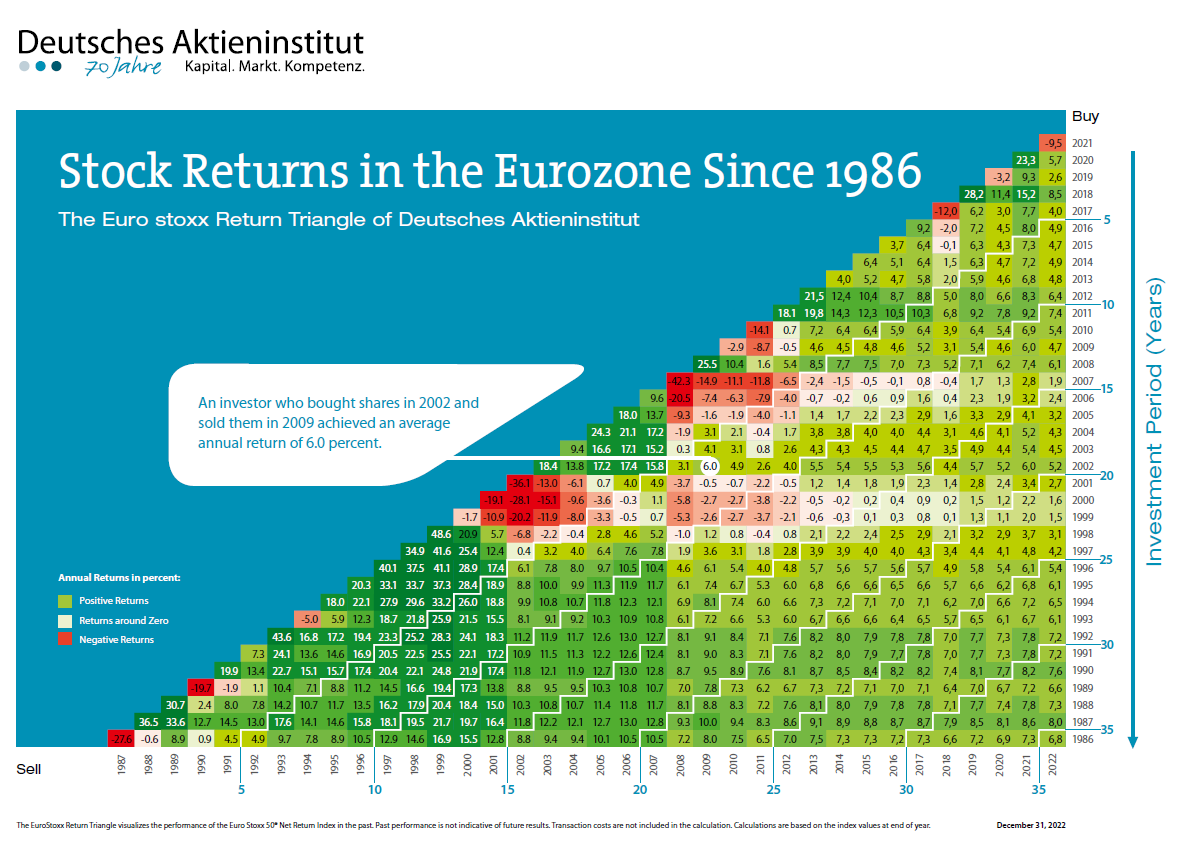
The German Stock Institute published their updated version of the DAX Index Annual Returns Triangle Chart for the years from 1953 to 2021. According to this chart, the average annual return on the DAX return over the past 70 years thru 2021 was 8.9%. For the most chart the chart shows positive returns in any given period.

Click to enlarge

Note: Use Google Translate since the text in the chart above is in German

Source: German Equity Institute 

Related ETF:

  • iShares MSCI Germany Index Fund (EWG)

Disclosure: No Positions

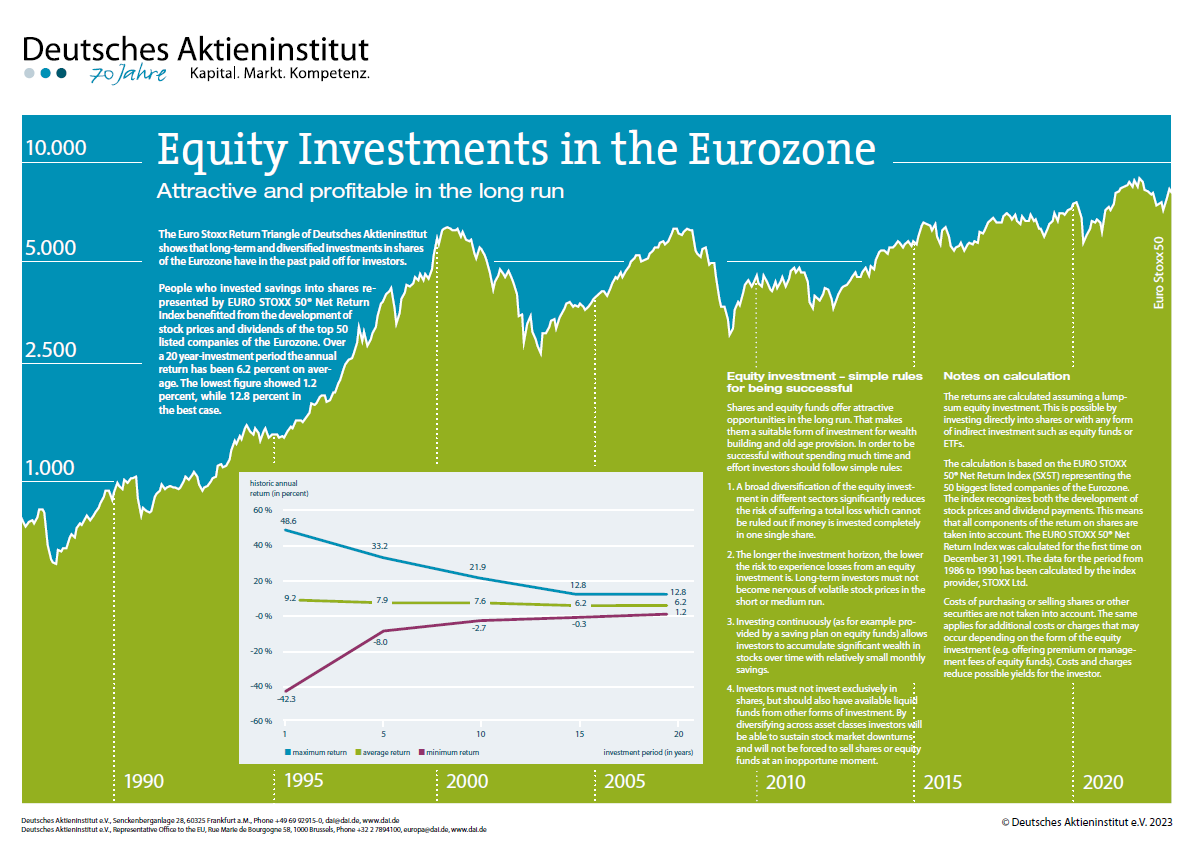
Always Focus on the Market’s Long-Term Performance: S&P 500 Example

Equity markets always go through periods of booms and busts. During bull markets, stocks can earn astonishing returns and of course when markets turn the other way losses can be shocking. Sometimes the volatility on both ways can be gut wrenching. For stock investors the key attribute for success is to side out the volatility and focus on the long term goal. Simply getting worried about day-to-day movements of the market is not useful.

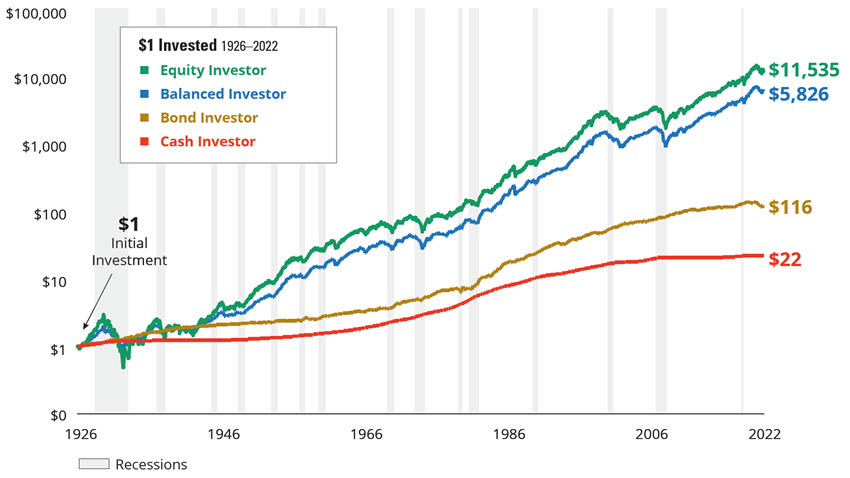
With that said, the following charts the performance of four investments over the long term from 1926 to 2022:

Click to enlarge

Source: It’s Easy to Forget the Market’s Good Years, Hartford Funds

The chart shows the stocks earned the best returns and cash was the worst performer. Bonds also fared poorly relative to stocks.

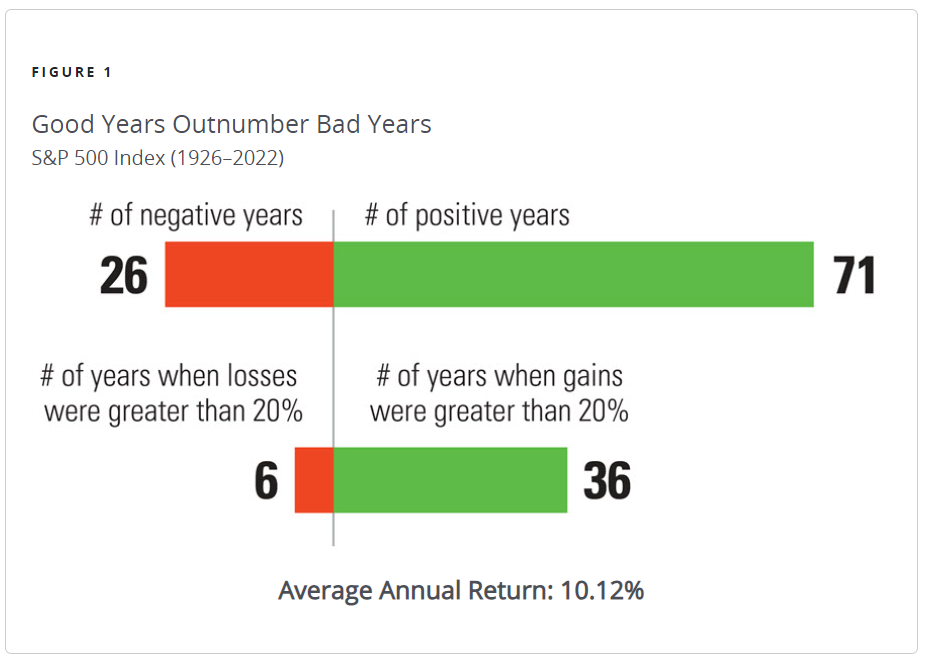
Another important point to remember is that over many years the number years with positive returns are higher than the number of years with negative returns. So by holding stocks for the long run, investors can generate a decent return.

Click to enlarge

Source: It’s Easy to Forget the Market’s Good Years, Hartford Funds

Related ETFs:

  • SPDR S&P 500 ETF (SPY)
  • Vanguard S&P 500 ETF (VOO)

Disclosure: No positions

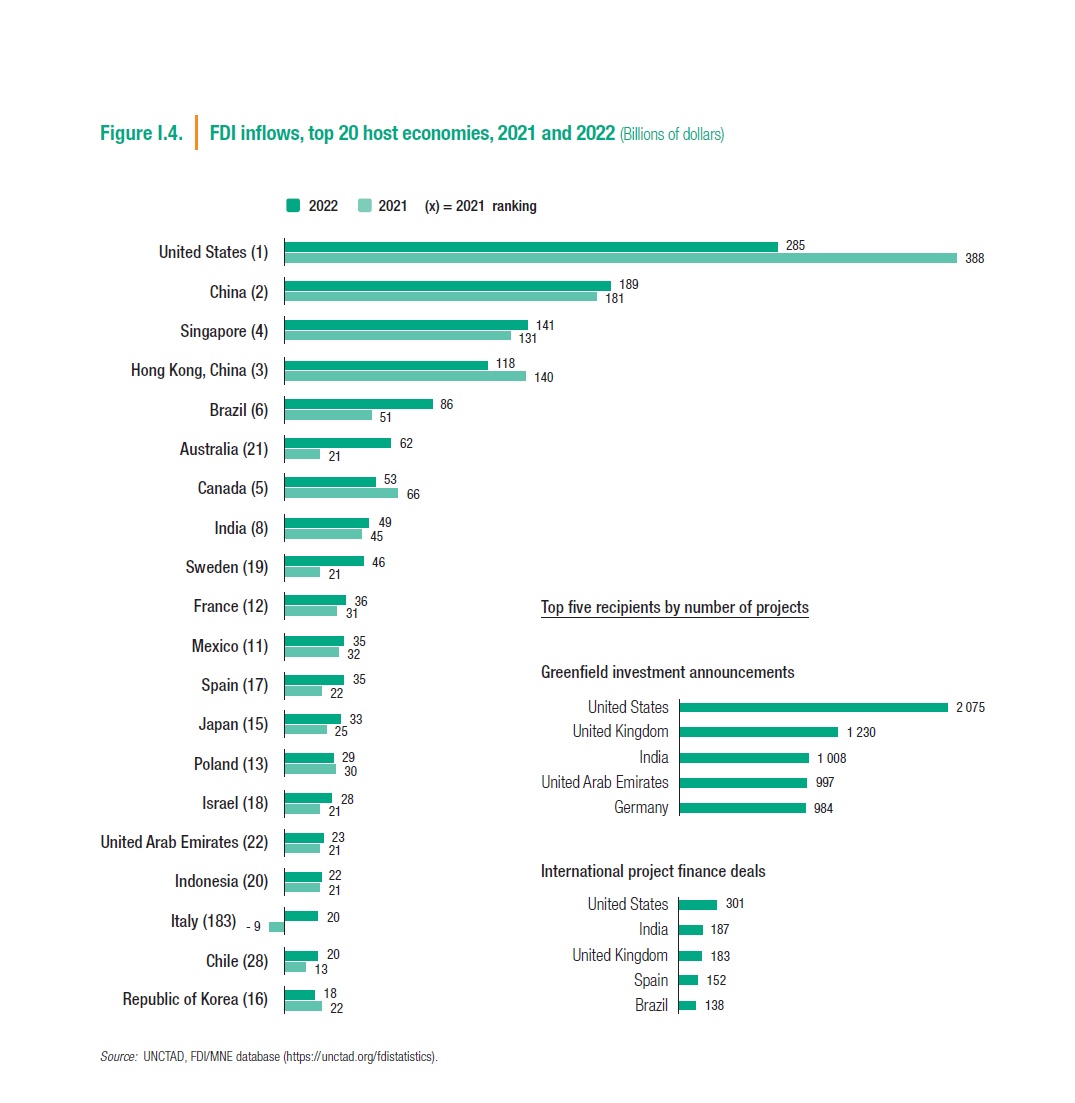
The Top 20 Host Economies of FDI Inflows in 2022: Chart

The Top 20 Host Economies of FDI Inflows in 2022 is shown in the chart below. The US was again the world’s top country for Foreign Direct Investment with an inflow if $285 billion. This was 26% less than the figure in 2021. The next top destinations for FDI were China, Singapore, Hong Kong and Brazil. Though Mexico is considered as a rising competitor to China, the FDI inflow is nowhere near China’s. Mexico received just $35 billion in inflows compared to China’s $189 billion in 2022.

Click to enlarge

Source: World Investment Report 2023, UNCTAD