Do U.S. Stocks Always Outperform Foreign Stocks?

In the past few years US stocks have outperformed developed international stocks. As a result, some investors may be complacent and assume that American equities always beat foreign stocks and that there is no reason to bother with foreign markets. Some investors even assume that they can simply gain exposure to foreign markets by simply owing some of the large cap companies in the S&P 500 since many of them have substantial presence in overseas markets.

While it is true that US stocks have performed well recently it does not mean they always outperform foreign stocks. According to an article by Dan Egan at robo advisor Betterment foreign stocks beat US stocks about 50% of the time based on 2-year rolling returns since 1970. From the article:

In the chart below, we show rolling two-year returns of the U.S. stock market (light blue) and developed international stock markets (dark blue). The gray shading indicates a period of time where international markets beat domestic markets. As you can see, international wins about 50% of the time. With a diversified portfolio, you’re aiming for the middle of U.S. and international stocks. That doesn’t mean experiencing zero losses—it means getting average gains.

Click to enlarge

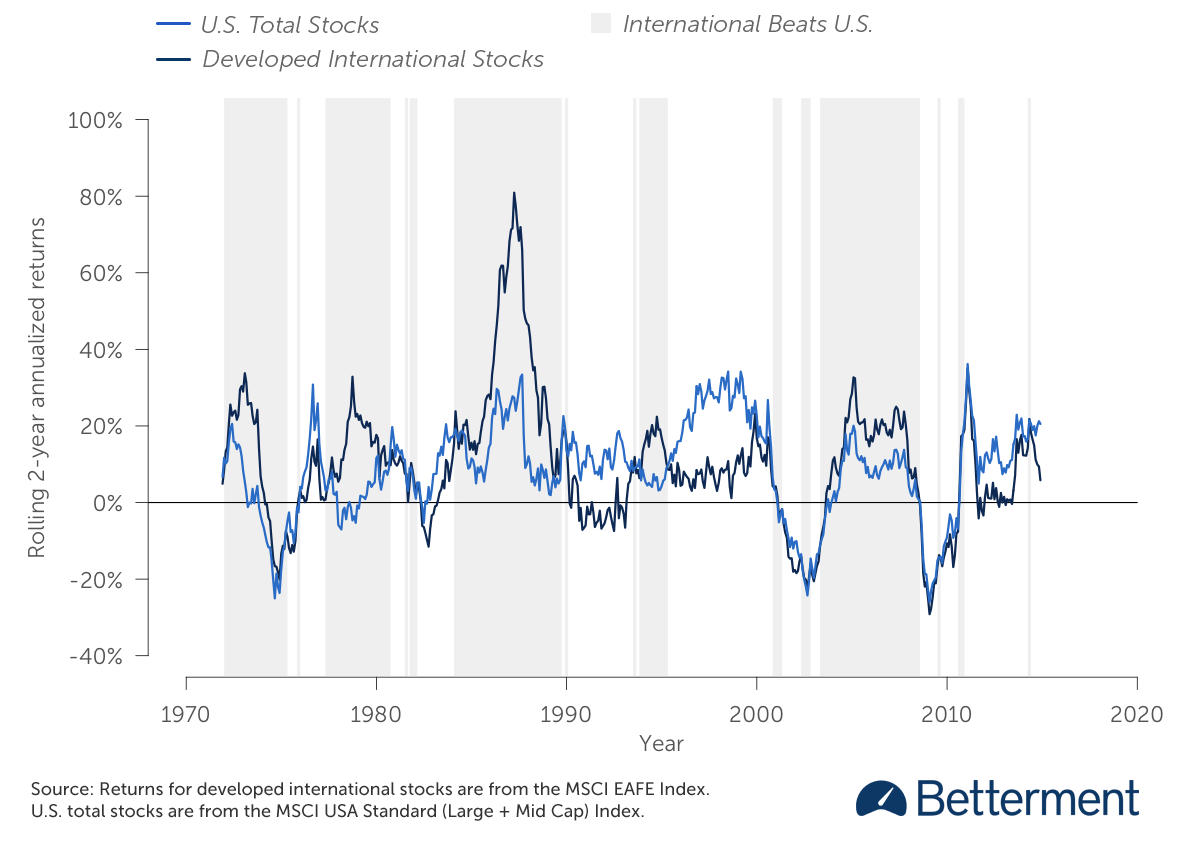
Source: Why You Should Invest Beyond U.S. Stocks by Dan Egan, Betterment

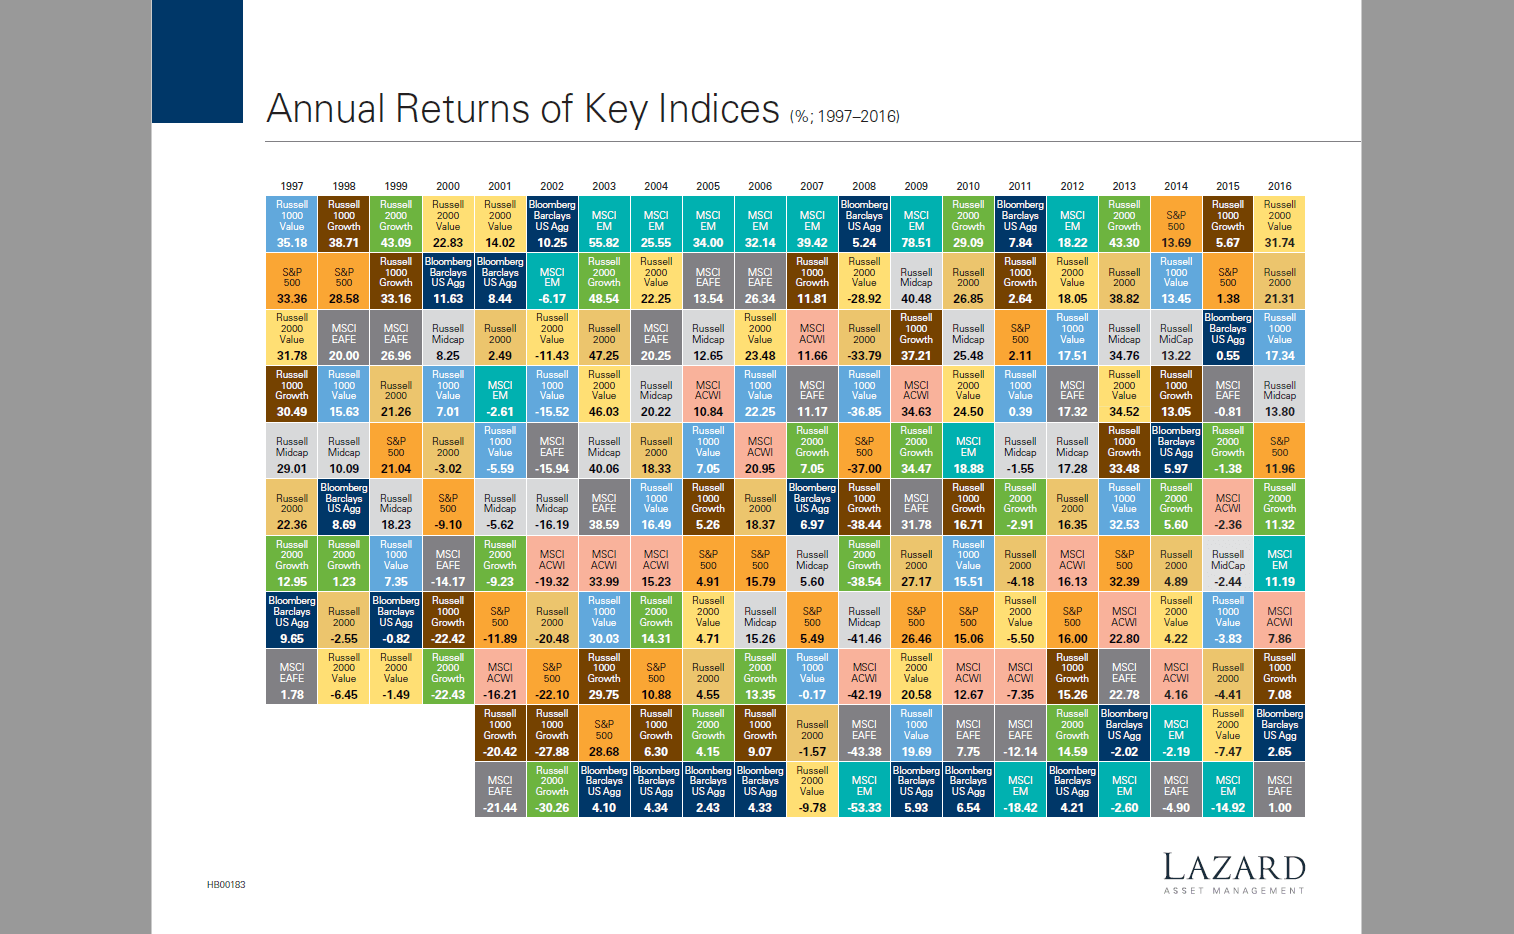
The following chart from Fidelity shows that US stocks beat international stocks in some years and vice versa:

Click to enlarge

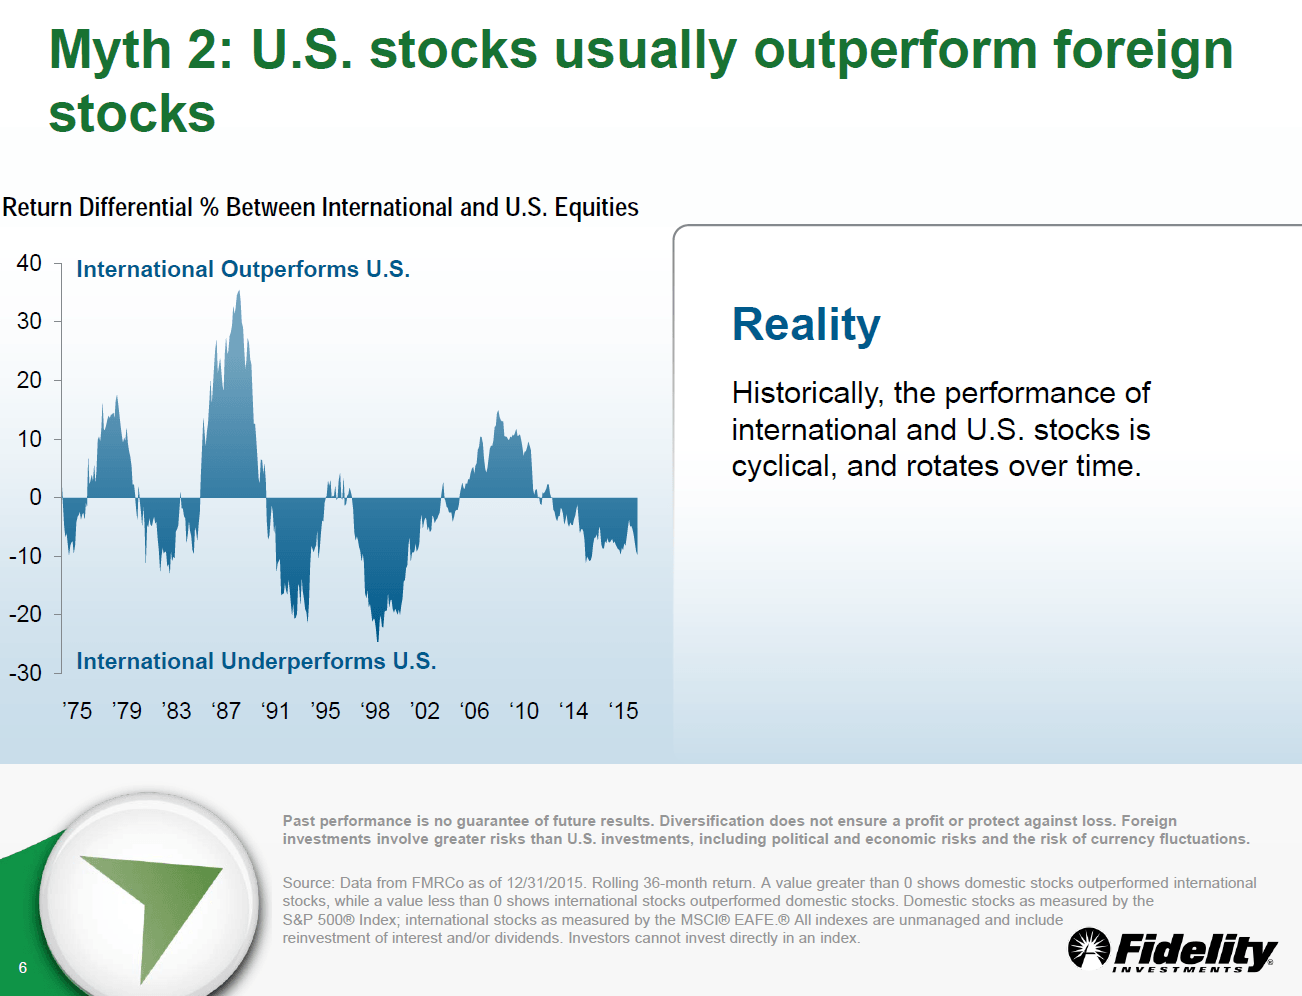
Source: 5 Myths of International Investing, Fidelity

So the key takeaway is that international diversification is necessary for American investors in order to earn higher returns and/or smoothen a portfolio’s returns over many years. Avoiding foreign stocks because domestic stocks have outperformed in recent years is not a wise strategy.

Related ETFs:

  • SPDR S&P 500 ETF (SPY)
  • iShares MSCI Emerging Markets ETF (EEM)
  • Vanguard MSCI Emerging Markets ETF (VWO)
  • SPDR Euro Stoxx 50 ETF (FEZ)

Disclosure: No Positions

The Annual Performance of Bank Stocks by Global Region Since 2007

Global investors fled banking stocks after the financial crisis of 2008-09. Some have totally avoided them since then due to many factors including relatively higher risks than other sectors and fear of unknowns. Banks in some countries and regions have recovered strongly since 2008-09 while others have not. For instance, the US banking sector has recovered following the crisis. But many of their peers in Europe have struggled to gain traction due to lack of bold actions on their part and dithering by politicians and regulators.

According to an article published yesterday by Schroders, in the 10 years since 2007 Asian banks are the top performers followed by US banks.UK banks have been the worst performers.From the article:

The global banking sector returned 13.7% in 2016 with dividends included, according to MSCI data. In comparison, the MSCI World index returned a more modest 8.2%.

Among banks, the biggest gains were made by the US and UK, although Asian and European banks were also significantly higher.

However, the gains have come after years of underperformance which began with the global financial crisis a decade ago. It was the trigger for a wider economic malaise and also led to a crackdown on the banking sector by regulators.

Even after 2016’s gains the MSCI world banking index was still 14.1% lower than it was 10 years ago. If you had invested $1,000 in MSCI world banking index on 31 December in 2006, your investment would be worth $859, as of 31 December 2016.

In comparison, $1,000 invested in the MSCI World Index over the same period would today stand at $1,497. Again, these are total return figures that include the payment of dividends.


Source: Is it still worth investing in bank shares? by  David Brett, Investment Writer, Schroders

Key takeaways:

  1. American banks are in a much better shape than other developed market banks. However though some of banks’ share prices have reached their pre-crisis level, the dividend payments are still lower than before the crisis. As stronger banks improve their earnings dividends should increase as well.
  2. In Europe, its better to avoid British and German banks. Investors can look at banks in Spain, The Netherlands and Scandinavia. Swedish banks are particularly strong and have decent dividend yields.
  3. In Asia, Aussie and Singapore banks offer potential opportunities.
  4. Brazilian banks continue to be shaky due to the ongoing political crisis and economic malaise there. Investors can consider banks in Mexico, Peru, Chile and Colombia.

How Diversified is India’s Sensex Index?

The S&P BSE SENSEX, the benchmark index of the Indian equity market is diversified but concentrated in a few sectors. The following chart shows the sector composition of the index:

Click to enlarge

Source:Sector Diversification through Index Linked Products, Indexology Blog

The 30 constituents in the Sensex are from ten sectors as shown above. As with many emerging markets, financials accounts for nearly one-third of the index. The next largest sector is the IT sector accounting for about 14%. Together just these two sectors constitute about half of the index allocation. According to S&P, finance and IT have consistently had a high allocation in the index from 2012.

US-listed banking giants HDFC Bank Ltd (HDB) and ICICI Bank Ltd(IBN) are part of the Senxex.

From an investment standpoint, ETFs that track the Sensex offer diversification benefits but with a heavy focus on finance and IT.

As far as I know, none of the India ETFs trading on the US markets track the Sensex. The largest ETF in terms of size, the iShares MSCI India ETF(INDA) follows the MSCI India Index.

Disclosure: No positions