Why Invest in European Stocks Now

European stocks have performed well so far this relative to US stocks and the past. According to a research report by Oppenheimer Funds, many factors tend to favor investing in European stocks relative to their US peers. The below chart shows compares the performance over the long-term.

Click to enlarge

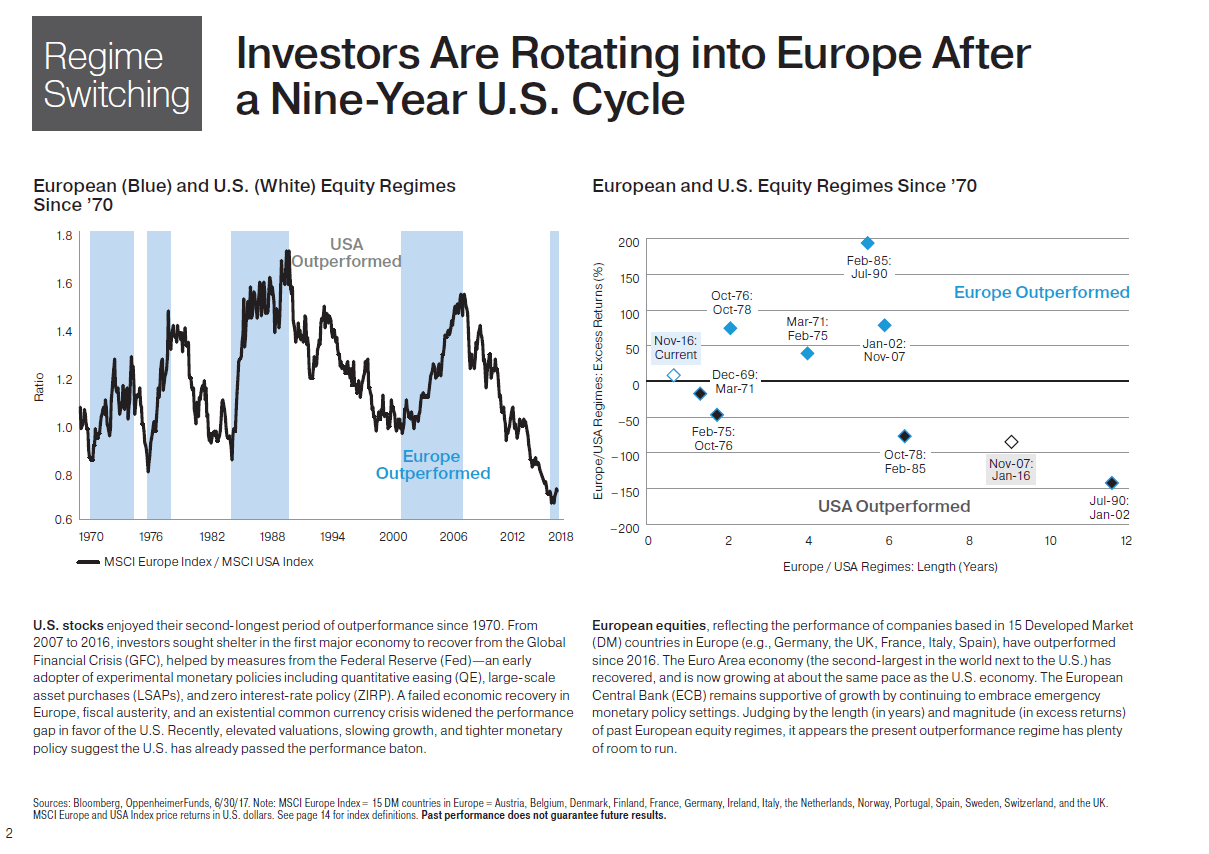
Source: Oppenheimer Funds

Download report9 Reasons to Consider European Stocks (in pdf)

On The Relationship Between Economic Growth and Life Expectancy in G-7 Countries

Higher economic growth does not necessarily lead to better well being of a country’s citizens. Among the G-7 member countries the US has the highest GDP per capita but the lowest life expectancy according to an article by Prof.John Ross, Senior Fellow at Chongyang Institute for Financial Studies, Renmin University of China. The fact that Americans die younger despite high GDP growth per capita proves that factors such as social and environmental are important.

From the article:

The G7 Figure 4 therefore show life expectancy in the major advanced countries – the G7. This shows an average American has a life expectancy of only 78.7 years – compared to 83.8 years in Japan, 83.5 years in Italy, 82.7 years in France, 82.1 years in Canada, 81.6 years in the UK, and 81.1 years in Germany. The US is the only G7 country with a life expectancy of less than 80.
Figure 4
Detailed examination shows the relative situation of the US is even more serious. ​As the US has the highest per capita GDP of any major country it would therefore be expected that its life expectancy would be the highest of any major country. But the facts show that that the US has a much lower life expectancy than any other G7 economy – average life expectancy in the US is four years less than would be expected from its per capita GDP. The US also ranks 8th in the world in terms of per capita GDP but only 40th in terms of life expectancy – that is the US rank in life expectancy is 32 places lower than its position in per capita GDP. This US data is by far the worst for any G7 country.
The G7 countries which have a higher life expectancy than the US all achieve this not by having a higher per capita GDP than the US but by having better social and environmental conditions – shown by their having a rank in life expectancy that is far higher than their rank in per capita GDP. Therefore social, environmental etc. conditions in these countries are far more conducive to a long life than the US despite having lower per capita GDPs. The US performs far worse than any other G7 country.
Table 2
Picture

Differences in social model The fact Americans die earlier than those in the other major advanced economy shows that component parts of the American system – a US health care system which is private, US pollution, US poverty and interlinked ethnic discrimination, the US’s high level of civic violence, and other features mean Americans die far younger than would be expected from the country’s per capita GDP – and younger than in other comparable economies. It turns out the ‘American way’ literally subtracts from the life of Americans. No system which condemns its citizens to an early death could be called ‘the greatest’ as US politicians claim.In contrast, as already noted, of the world’s 10 countries with the highest life expectancy all have high per capita GDP with seven being in Europe (Italy, Spain, Switzerland, Iceland, France, Sweden and Australia) and three in Asia (Hong Kong SAR, Japan and Singapore). For studying the combination of per capita GDP and non-economic factors these countries are therefore the key ones from which to draw positive lessons. It is therefore clear that if the goal is not highest per capita GDP, but the maximising of social well-being, then the lessons of the US model are negative while the lessons of Europe and some high income Asian countries are positive.

The entire article is worth a read.

The S&P 500® Dividend Aristocrats List 2017

The S&P 500® Dividend Aristocrats® Index measure the performance of S&P 500 companies that have increased dividends every year for the last 25 consecutive year or more. Companies achieveing the aristrocrats desingation are unique since increasing dividends for many years is not an easy. Invstors looking for consistent dividend payers among the S&P 500 companies can consider looking into these aristocrats.

The list of S&P 500® Dividend Aristocrats for this year are shown in the table below:

S.No.Company/TickerSectorNumber of Years of Dividend Increase
1Dover (DOV)Industrials61
2Emerson Electric (EMR)Industrials60
3Genuine Parts (GPC)Consumer Cyclical60
4Procter & Gamble (PG)Consumer Defensive60
53M (MMM)Industrials58
6Cincinnati Fin. (CINF)Financial Services56
7Johnson &Johnson (JNJ)Healthcare54
8Coca-Cola (KO)Consumer Defensive54
9Lowe’s Companies (LOW)Consumer Cyclical54
10Colgate-Palmolive (CL)Consumer Defensive53
11Hormel Foods (HRL)Consumer Defensive51
12Stanley Blk&Dckr (SWK)Industrials49
13Target (TGT)Consumer Defensive49
14Sysco (SYY)Consumer Defensive47
15CR Bard (BCR)Healthcare45
16Becton Dickinson (BDX)Healthcare45
17W W Grainger (GWW)Industrials45
18Leggett & Platt (LEG)Consumer Cyclical45
19PPG Industries (PPG)Basic Materials45
20Kimberly-Clark (KMB)Consumer Defensive44
21Nucor (NUE)Basic Materials44
22PepsiCo (PEP)Consumer Defensive44
23VF (VFC)Consumer Cyclical44
24AbbVie (ABBV)Healthcare43
25Abbott Laboratories (ABT)Healthcare43
26S&P Global Inc. (SPGI)Industrials43
27Wal-Mart Stores (WMT)Consumer Defensive43
28Automatic Data (ADP)Industrials42
29Consolidated Edison (ED)Utilities42
30Illinois Tool Works (ITW)Industrials42
31Archer-Daniels Midland (ADM)Consumer Defensive41
32McDonald’s (MCD)Consumer Cyclical41
33Pentair (PNR)Industrials41
34Walgreens Boots (WBA)Consumer Defensive41
35Clorox (CLX)Consumer Defensive39
36Medtronic (MDT)Healthcare39
37Sherwin-Williams (SHW)Basic Materials38
38Franklin Resources (BEN)Financial Services37
39Aflac (AFL)Financial Services34
40Air Products & ChemicalsBasic Materials34
41Cintas (CTAS)Industrials34
42Exxon Mobil (XOM)Energy34
43Brown-Forman (BF.B)Consumer Defensive33
44AT&T (T)Communications33
45Cardinal Health (CAH)Healthcare31
46HCP (HCP)Real Estate31
47McCormick & Co. (MKC)Consumer Defensive31
48T. Rowe Price (TROW)Financial Services30
49Chevron (CVX)Energy29
50MDU Resources Group (MDU)Basic Materials26
51SEI Investments (SEIC)Financial Services26
52Ecolab (ECL)Basic Materials25
53General Dynamics (GD)Industrials25

Source: S&P and Dividend Builder

Download: The S&P 500® Dividend Aristocrats 2017 (in Excel)

Of the companies listed above 26% ocompanies from the consumer staples sector. Just 2% are in the tech sector.

Disclosure: No positions

Comparing the Sector Composition of Emerging and Developed Market Indices

I came across the following table showing the sector weightings in the MSCI Emerging Markets Index and select developed market indices:


Click to enlarge

Note: The data shown above are as of Dec, 2016. So the weightings may have changed since then.

Some of the high-level observations from the above are:

  • Canada’s TSX Composite index is heavily concentrated in financials followed by energy and materials.
  • Emerging markets are also dominated by Financials. On the other hand the US index has about 15% in financials.
  • The tech sector accounts for about one-fifth of the S&P 500 but the EAFE and TSX indices have low tech sector weightings. It is surprising that the sector is the 2nd largest sector in the emerging markets index.

Source: The Case for Emerging Markets, Connor, Clark & Lunn Financial Group

Going Abroad Can Reduce Equity Risk And Boost Returns: Infographic

Investing in foreign stocks offer many advantages such as a wide universe of stocks to choose, higher dividend yields in some markets, different earnings growth rates and potential high growth opportunities, etc. The following infographic shows some of the beneits of going overseas:

Click to enlarge

Source: Global Vision Enhances Equity Insight by Mark Phelps, Scott Krauthamer, Alliance Bernstein