The US National Debt Surpasses $38 Trillion: Infographic

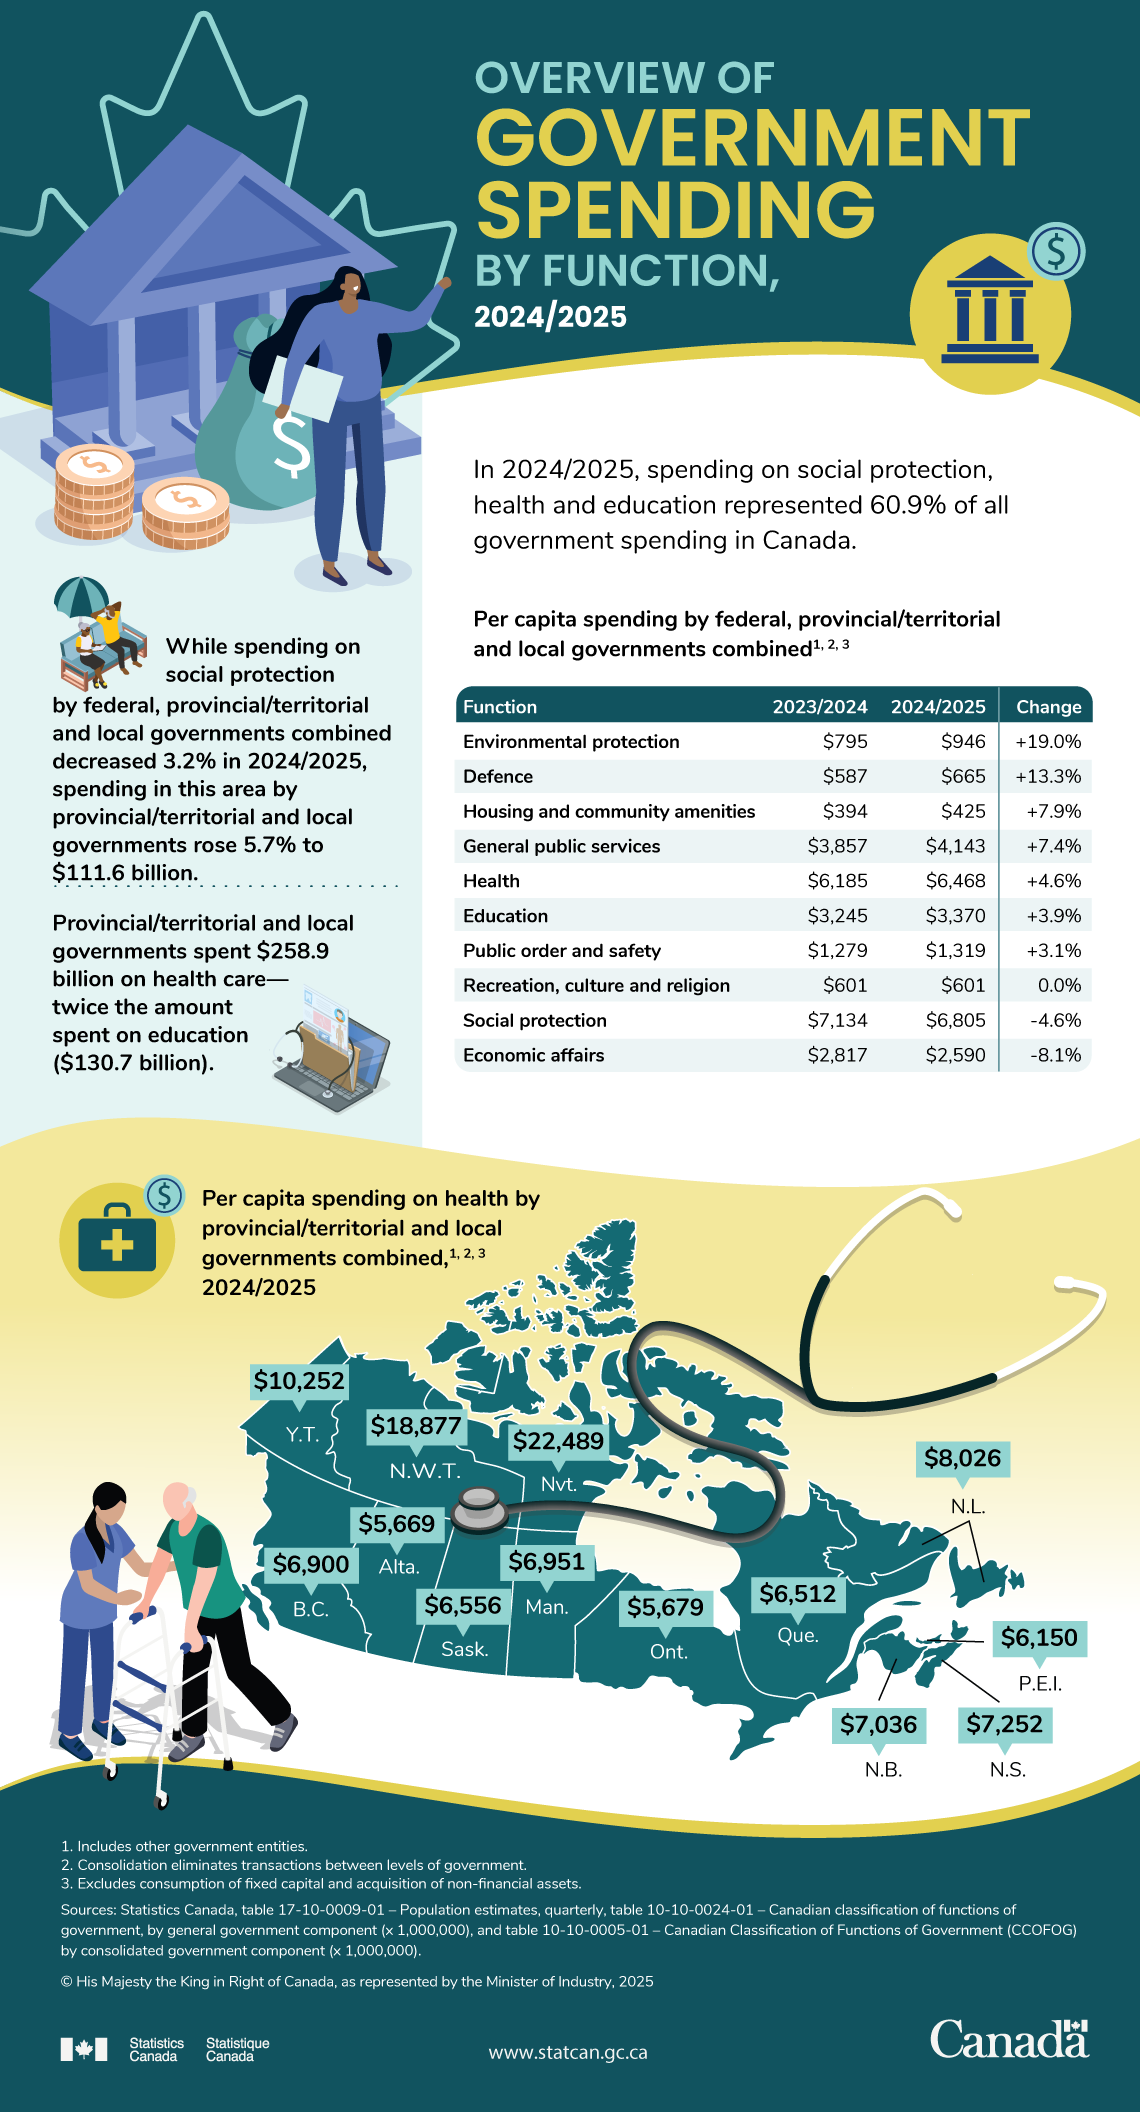
The US debt mountain continues to grow. The Gross Federal debt has crossed $38 Trillion (or)$38,000,000,000,000 according to an article at the Peter G. Peterson Foundation. Since this is a such huge amount, the following infographic puts the number in perspective in a few ways. While most this debt is held by the general public it still needs to be serviced. Hence interest payments amount to an astonishing $3.0 billion per day.

Click to enlarge

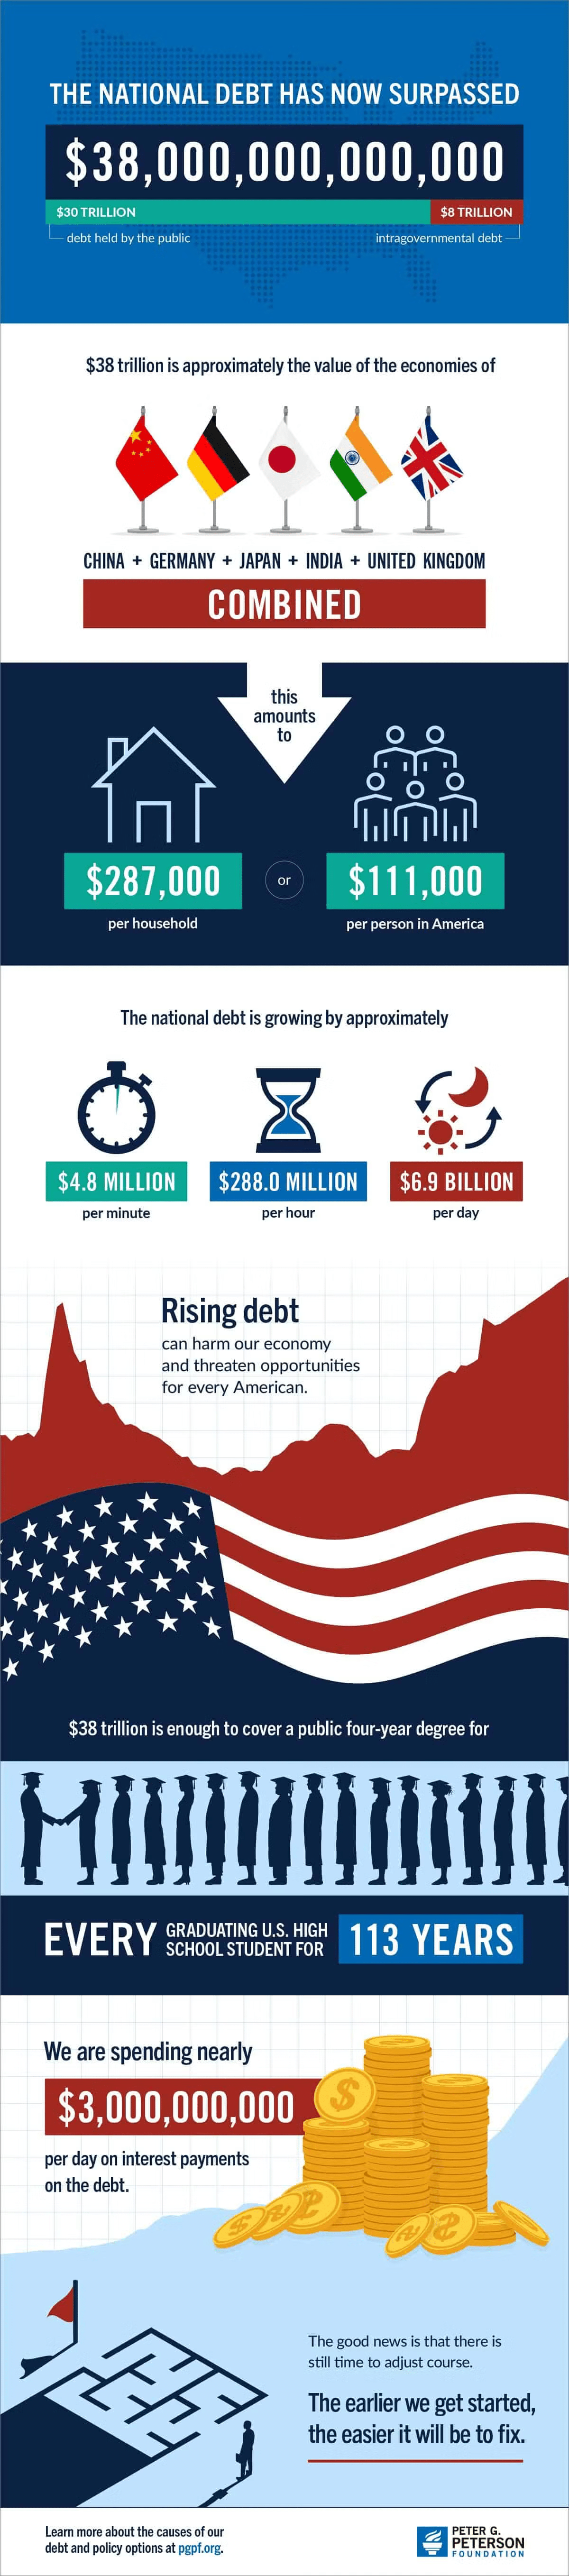
Source: Infographic: The National Debt Is Now More than $38 Trillion. What Does That Mean?, Peter G. Peterson Foundation

Dividend Withholding Tax Rates by Country for 2026: Chart

Most countries charge a withholding tax on dividends paid out by domestic companies to foreign investors. This tax can be substantial for some countries and will reduce the dividend yield. So its very important to consider the dividend withholding tax rates when picking foreign stocks. In addition to this tax, ADRs may also include other fees such as pass-through fees which we will discuss in another post later.

S&P Global has updated their one-pages on the dividend withholding taxes for 2026. This table shows the rates for each country as of Dec 29, 2025. The highest rate is 35% by countries such as Switzerland, Belgium, Chile, etc. On the other hand, some have 0% rates. For instance, Singapore charges 0% on stocks but 10% for REITs.

Canada has a 25% rate but can be reduced to 15% by submitting a form through brokers. For Canadian stocks held in US qualified retirement accounts like the IRAs there is no dividend withholding tax at all. This is a great benefit for US investors.

Click to enlarge

Source: S&P Global

Related:

An Update on the Declaration of Eligibility for Canadian Tax Treaty Benefits

Canada S&P/TSX Composite Index Annual Total Returns from 1920 to 2024: Chart

The average annual return of the Canadian equity market is 7.55% based on data over the past 100 years. As with other developed markets, in most of the years the returns were positive and when there was negative return year it was followed by positive returns. The below chart shows this pattern in the years 1998 and 1999. While 100 years is a too of a period to hold stocks for most investors, any duration measured in years or decades lead to a positive return.

Click to enlarge

Source: 2025 Quick Reference Guide, AGF

Related ETF:

  •  iShares MSCI Canada ETF (EWC)

For investors interested in individual companies, this page shows the full list of Canadian stocks trading on the US markets.

Disclosure: No positions

Three Reasons Why Canadian Investors Must Invest Abroad

The Canadian equity market is one of the largest markets in the world. According to TSX, the total market capitalization of companies listed in the TSX and TSX Venture Exchanges was $5.0 Trillion as of 2024. A total of 3,417 companies were publicly traded on these exchanges. For Canadian investors it may seem like the home market is more than enough to find attractive opportunities. However that is not the case. I have written about why Canadian investors must diversify globally earlier. This is a followup quick post on the topic.

Three reasons why investors in Canada must invest overseas are:

  1. The Canadian equity market represents less than 3% of the world’s market capitalization based on MSCI World Index at the end of 2024.
  2. Of the Top 500 companies the world, only 14 are in Canada.
  3. About 75% of the market is concentrated in just 4 sectors – Financial Services, Energy, Industrials and Materials. Globally these sectors account for only about 35%.

Source: 2025 Investing Quick Reference Guide, AGF

The S&P/TSX composite index has had a return of over 29.41% on price return basis (C$) as of Dec 26, 2025. The following chart shows the concentration of the four sectors in the index as of Nov end, 2025:

Click to enlarge

Source: S&P

From a return perspective, it is possible to earn higher returns investing abroad. For example, Canadian stocks returned 21.65% in 2024 while US equities returned 36.36% in Canadian dollar terms. There were many other countries that generated even better returns.

Overview of Canadian Government Spending 2024-25: Infographic

The Canadian government spends a substantial portion of the annual budget on social protection, education and healthcare. Defense accounts for small percentage of the overall spending. According to the latest date published by Statistics Canada, defense spending increased by over 13% in 2024-25 on a per capital basis. Provincial and local governments spent twice the amount on health care relative to the amount spend on education.

The following infographic shows an overview of government spending by function for 2024-25:

Click to enlarge

Source: Statistics Canada

Checkout also: Canada fact of the day, The Marginal Revolution