Emerging Markets Returns by Country 2011 to 2025: Chart

Investing in emerging markets is riskier than investing in developed markets. One way to reduce risk and still gain from these markets is by diversifying part of one’s portfolio among a bunch of emerging markets. The best performing market in one year can easily become the worst next year. The following annual returns chart for emerging markets from 2011 to 2025 from Novel Investor shows this figuratively. For example, Turkey was the best performer in 2022 with a return of over 91%. However the following year, it was one of the worst with a loss of 3.5%. Hungary which was the worst market in 2022 turned into the best market in 2023 with a gain of over 50%.

In 2025, Colombia had the highest return at over 115% followed by South Korea. Colombian stocks are on a tear this year also. For instance, the year-to-date returns of a few exchange-listed Colombian ADRs are shown below:

Grupo Cibest S.A. (CIB): 28.36%

Grupo Aval Acciones y Valores (AVAL): 18.77%

Ecopetrol (EC): 25.45%

Note: Returns shown above are excluding dividends and thru Jan 30,2026.

The Colombian equity market is rising this year as many Colombian firms are expected to benefit from the improving political situation in Venezuela.

Click to enlarge

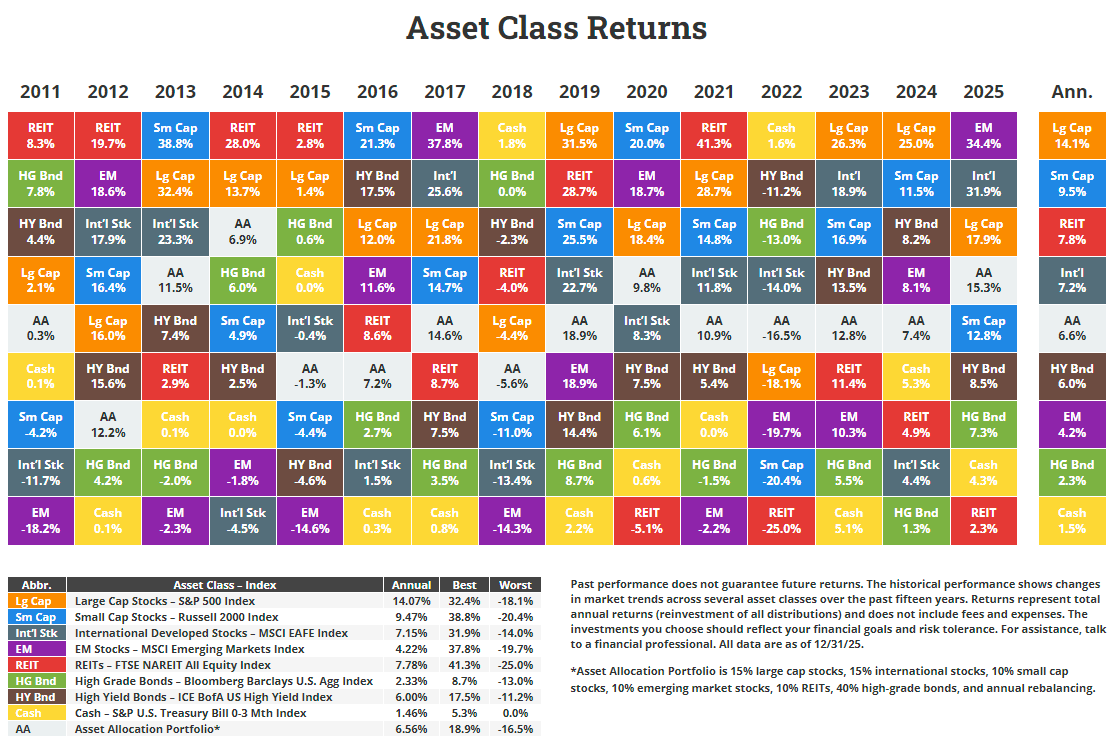
Note: The returns shown above are total returns that include dividends reinvested. And the returns are based on the MSCI indices for each country.

Source: Novel Investor

For an interactive version of the above chart, click on the link above.

Related ETFs:

  • The Global X MSCI Colombia ETF (COLO)
  • WisdomTree India Earnings (EPI)
  • The iShares MSCI India ETF (INDA)
  • iShares MSCI Mexico Capped Investable Market (EWW)
  • iShares FTSE/Xinhua China 25 Index (FXI)

Disclosure: Long EC and CIB

S&P 500 Sector Performance 2011 To 2025: Chart

The S&P Sector Performance chart for the year 2025 was published by Novel Investor recently. This chart shows the annual total returns of the various sectors in the S&P 500 index from 2011 to 2025. Tech was the best performer as represented by the communications (TELS) and information technology(INFT) sector and the worst performer was the real estate sector.

Click to enlarge

Source: Novel Investor

For an interactive version of the above chart click on the link above.

Related ETFs:

  • SPDR S&P 500 ETF (SPY)
  • S&P MidCap 400 SPDR ETF (MDY)
  • SPDR Consumer Discretionary Select Sector SPDR Fund (XLY)
  • SPDR Consumer Staples Select Sector SPDR Fund (XLP)
  • SPDR Energy Select Sector SPDR Fund (XLE)
  • SPDR Financials Select Sector SPDR Fund (XLF)

Disclosure: No Positions

Developed Market Annual Total Returns from 2011 to 2025: Chart

Novel Investor has updated their annual returns chart for the developed markets from 2011 to 2025. The top performing market among the developed markets in 2024 was Spain with a total return of over 83% followed by Austria and Finland. The worst performer was Denmark followed by New Zealand.

Click to enlarge

Note: All returns shown above are total returns in US dollars (including dividends reinvested) and are based on MSCI country index returns.

Source: Novel Investor

Related ETFs:

  • iShares MSCI Germany Index Fund (EWG)
  • iShares MSCI Canada Index Fund (EWC)
  • iShares MSCI Australia Index Fund (EWA)
  • iShares MSCI United Kingdom Index (EWU)
  • iShares MSCI Singapore Index (EWS)

Disclosure: No positions

The Periodic Table of Commodities Returns 2025: Chart

U.S. Global Investors have updated their popular The Periodic Table of Commodities Returns chart with 2025 data. Silver was the top performing commodity last year with a return of over 145% followed by other precious metals like Platinum, Palladium and Gold. Crude oil lost about 20%. This year crude oil may bounce back again.

Click to enlarge

Source: U.S. Global Investors

An interactive version of the chart can be found in the link above.

Related ETFs, Stocks and ETNs:

  • United States Oil Fund LP (USO)
  • Albemarle Corporation (ALB)
  • Sociedad Quimica y Minera de Chile (SQM)
  • SPDR Gold Trust (GLD)
  • iShares Silver Trust (SLV)

Disclosure: No positions

Average Annual Returns of Australian Stock Market from 1900 to 2024

Australian stocks have had an average annual return of 12.98% in the past 125 years through 2024 based on returns on the ASX All Ordinaries Accumulation index. In that time period, most of the years had a positive return. Only 24 years or 19% of the time had negative returns.

Click to enlarge

Source: Market Index Australia

Related ETFs and ADRs:

Disclosure: No positions