Key Events to Watch in 2018: Chart

Some of the key global events watch for investors this year are shown in the chart below. For example, Mexico has general elections in July and Brazil goes to the poll in October. Russia, another emerging market, is due for an election in March with Putin tipped to win again. From an investment standpoint, investors can expect some volatility and possible upside in these markets should there be no uncertainties.

Click to enlarge


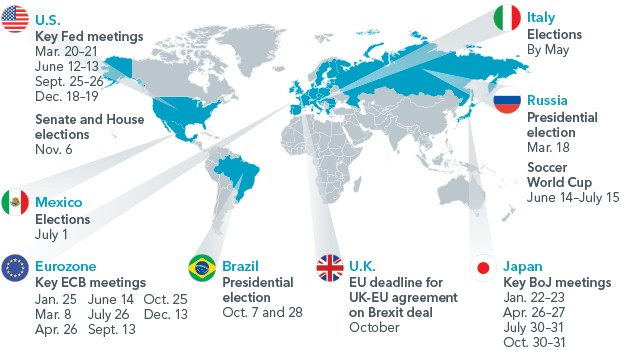
Source: GLOBAL INVESTMENT OUTLOOK 2018 – Our views for 2018, Blackrock

The S&P 500 and US Treasury Bonds Historical Total Returns by Year: Chart

The US stock and bond market performed very well last year. US equities as measured by the S&P 500 yielded total returns that were well above the historical average and US Treasury bonds also earned above average total returns with a year-end return of 2.1%.

The chart below shows the annual total returns of S&P 500 and US treasury bonds by year fro 1873 ad 1900 respectively:

Click to enlarge


Source: Economic and Strategy Viewpoint January 2018, Schroders

The World’s Slowest Growing Economies in 2018: Chart

Last week I posted a chart showing the world’s fastest growing economies next year. The chart below shows the slowest growing economies in 2018 as predicted by The Economist magazine:

Click to enlarge

Source:Chart of the Day: The World’s Slowest Growing Economies, Canadian Investment Review

The UK is projected to have low economic growth next year due to the ongoing Brexit issues.